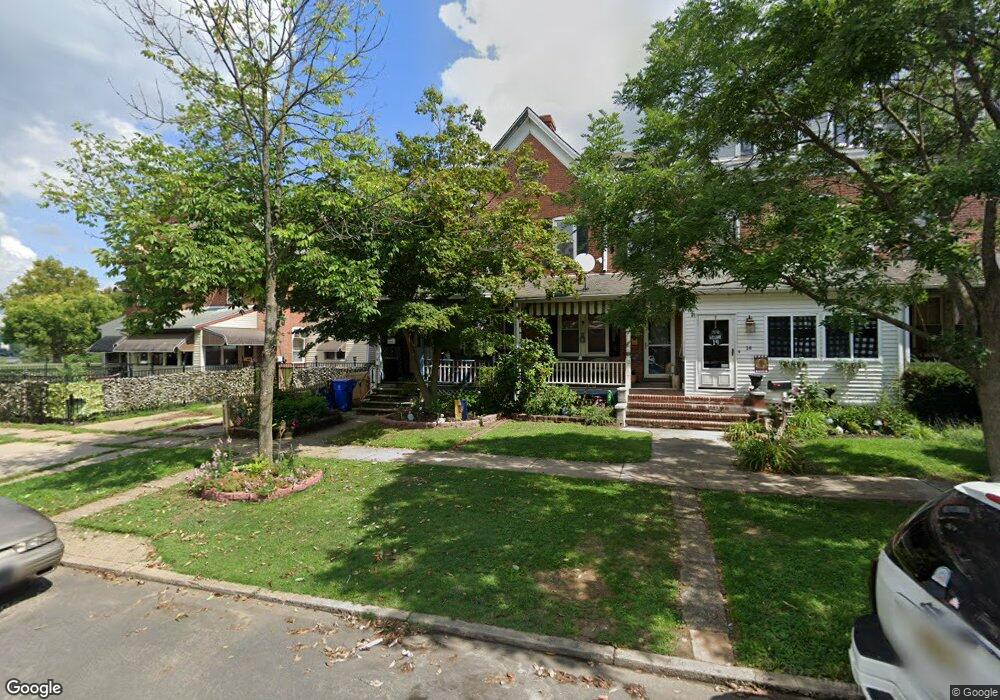
10 3rd Ave Roebling, NJ 08554
Estimated Value: $296,000 - $318,000
Studio
--
Bath
1,520
Sq Ft
$201/Sq Ft
Est. Value
About This Home
This home is located at 10 3rd Ave, Roebling, NJ 08554 and is currently estimated at $305,296, approximately $200 per square foot. 10 3rd Ave is a home located in Burlington County with nearby schools including Number 5, Roebling Elementary School, Riverfront Middle School, and Florence Twp Mem High School.
Ownership History
Date
Name
Owned For
Owner Type
Purchase Details
Closed on
Dec 11, 2025
Sold by
Ralko Mary and Ralko George
Bought by
Ralko Mary
Current Estimated Value
Home Financials for this Owner
Home Financials are based on the most recent Mortgage that was taken out on this home.
Original Mortgage
$181,808
Interest Rate
4%
Mortgage Type
New Conventional
Purchase Details
Closed on
Aug 16, 2001
Sold by
Hobora Raymond
Bought by
Blatchford Mary Leigh
Home Financials for this Owner
Home Financials are based on the most recent Mortgage that was taken out on this home.
Original Mortgage
$94,860
Interest Rate
6.98%
Mortgage Type
VA
Purchase Details
Closed on
Oct 25, 2000
Sold by
Wilshire Funding Corp
Bought by
Hobora Raymond
Purchase Details
Closed on
Feb 23, 2000
Sold by
Umlic Seven Corp
Bought by
Wilshire Funding Corp
Purchase Details
Closed on
Jan 21, 1997
Sold by
Daniels Gary L
Bought by
Umlic Seven Corp
Create a Home Valuation Report for This Property
The Home Valuation Report is an in-depth analysis detailing your home's value as well as a comparison with similar homes in the area
Home Values in the Area
Average Home Value in this Area
Purchase History
| Date | Buyer | Sale Price | Title Company |
|---|---|---|---|
| Ralko Mary | -- | Servicelink | |
| Blatchford Mary Leigh | $93,000 | Affiliated Title Of So Jerse | |
| Hobora Raymond | $35,000 | -- | |
| Wilshire Funding Corp | $48,340 | -- | |
| Umlic Seven Corp | -- | -- |
Source: Public Records
Mortgage History
| Date | Status | Borrower | Loan Amount |
|---|---|---|---|
| Previous Owner | Ralko Mary | $181,808 | |
| Previous Owner | Blatchford Mary Leigh | $94,860 |
Source: Public Records
Tax History
| Year | Tax Paid | Tax Assessment Tax Assessment Total Assessment is a certain percentage of the fair market value that is determined by local assessors to be the total taxable value of land and additions on the property. | Land | Improvement |
|---|---|---|---|---|
| 2025 | $4,066 | $145,900 | $48,900 | $97,000 |
| 2024 | $3,893 | $145,900 | $48,900 | $97,000 |
| 2023 | $3,893 | $145,900 | $48,900 | $97,000 |
| 2022 | $3,809 | $145,900 | $48,900 | $97,000 |
| 2021 | $3,526 | $145,900 | $48,900 | $97,000 |
| 2020 | $3,761 | $145,900 | $48,900 | $97,000 |
| 2019 | $3,728 | $145,900 | $48,900 | $97,000 |
| 2018 | $3,696 | $145,900 | $48,900 | $97,000 |
| 2017 | $3,400 | $145,900 | $48,900 | $97,000 |
| 2016 | $3,330 | $145,900 | $48,900 | $97,000 |
| 2015 | $3,257 | $145,900 | $48,900 | $97,000 |
| 2014 | $3,688 | $168,500 | $48,900 | $119,600 |
Source: Public Records
Map
Nearby Homes
Your Personal Tour Guide
Ask me questions while you tour the home.