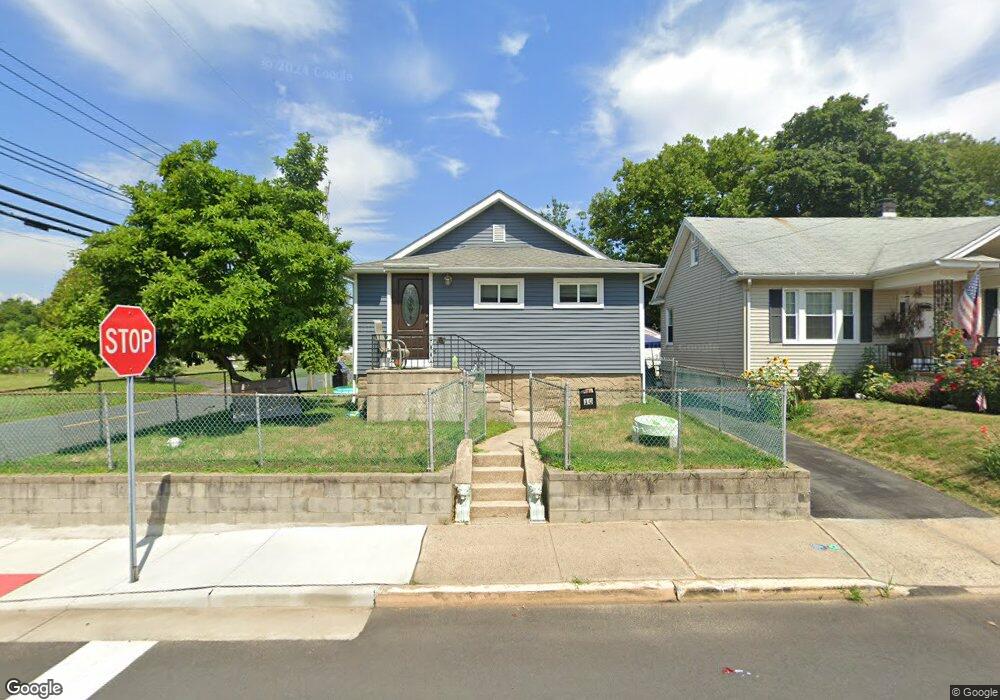
10 8th St Keyport, NJ 07735
Estimated Value: $278,000 - $416,000
3
Beds
1
Bath
924
Sq Ft
$395/Sq Ft
Est. Value
About This Home
This home is located at 10 8th St, Keyport, NJ 07735 and is currently estimated at $364,531, approximately $394 per square foot. 10 8th St is a home located in Monmouth County with nearby schools including Keyport Central School, Keyport High School, and Icob Academy.
Ownership History
Date
Name
Owned For
Owner Type
Purchase Details
Closed on
Apr 9, 2017
Sold by
Bonica Joseph and Spitallere Dina
Bought by
Bonica Joseph
Current Estimated Value
Purchase Details
Closed on
Feb 13, 2009
Sold by
Parlin Frances M and Parlin Lawrence E
Bought by
Bonica Joseph and Bonica Dina
Home Financials for this Owner
Home Financials are based on the most recent Mortgage that was taken out on this home.
Original Mortgage
$93,750
Interest Rate
4.93%
Mortgage Type
Purchase Money Mortgage
Create a Home Valuation Report for This Property
The Home Valuation Report is an in-depth analysis detailing your home's value as well as a comparison with similar homes in the area
Home Values in the Area
Average Home Value in this Area
Purchase History
| Date | Buyer | Sale Price | Title Company |
|---|---|---|---|
| Bonica Joseph | -- | Fidelity National Title | |
| Bonica Joseph | $125,000 | Fidelity Natl Title Ins Co |
Source: Public Records
Mortgage History
| Date | Status | Borrower | Loan Amount |
|---|---|---|---|
| Previous Owner | Bonica Joseph | $93,750 |
Source: Public Records
Tax History
| Year | Tax Paid | Tax Assessment Tax Assessment Total Assessment is a certain percentage of the fair market value that is determined by local assessors to be the total taxable value of land and additions on the property. | Land | Improvement |
|---|---|---|---|---|
| 2025 | $6,086 | $341,200 | $188,100 | $153,100 |
| 2024 | $5,833 | $294,000 | $163,600 | $130,400 |
Source: Public Records
Map
Nearby Homes
- 6 Octavia Place
- 72 Manchester Ave
- 74 Manchester Ave
- 2108 Florence Ave
- 231 Atlantic St Unit 23
- 231 Atlantic St Unit 83
- 9 Hurley St
- 162 2nd St
- 226 Osborn St
- 104 Church St
- 87 Church St
- 37 Myrtle Ave
- 40 Church St
- 8 Pine Creek Village
- 55 E Front St
- 75 Broad St
- 121-123 Stone Rd
- 9 Kearney St Unit A
- 308 Stone Rd
- 788 Poole Ave
Your Personal Tour Guide
Ask me questions while you tour the home.