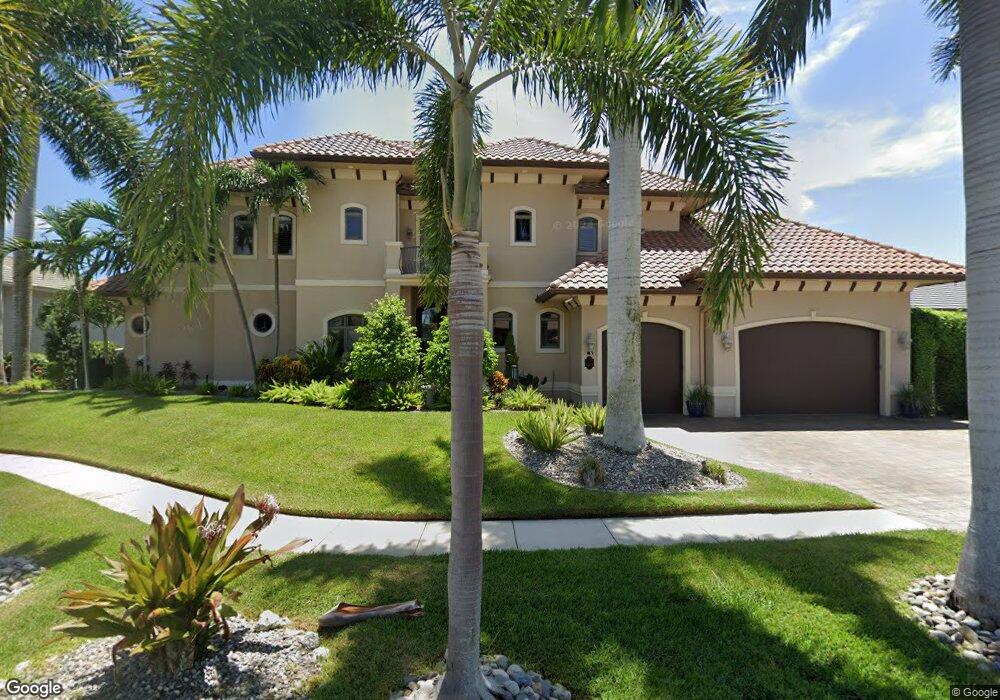
10 Acorn Ct Marco Island, FL 34145
Estimated Value: $1,609,000 - $2,020,000
--
Bed
--
Bath
2,086
Sq Ft
$886/Sq Ft
Est. Value
About This Home
This home is located at 10 Acorn Ct, Marco Island, FL 34145 and is currently estimated at $1,848,426, approximately $886 per square foot. 10 Acorn Ct is a home located in Collier County with nearby schools including Tommie Barfield Elementary School, Manatee Middle School, and Lely High School.
Ownership History
Date
Name
Owned For
Owner Type
Purchase Details
Closed on
Mar 26, 2004
Sold by
Tucker E Glenn
Bought by
Ehlen Thomas S and Ehlen Nancy J
Current Estimated Value
Home Financials for this Owner
Home Financials are based on the most recent Mortgage that was taken out on this home.
Original Mortgage
$525,000
Outstanding Balance
$244,816
Interest Rate
5.53%
Mortgage Type
Purchase Money Mortgage
Estimated Equity
$1,603,610
Purchase Details
Closed on
Aug 15, 2001
Sold by
Plat Larry and Pla Paula
Bought by
Tucker E Glenn
Home Financials for this Owner
Home Financials are based on the most recent Mortgage that was taken out on this home.
Original Mortgage
$200,000
Interest Rate
7.19%
Purchase Details
Closed on
Oct 18, 1999
Sold by
Alsbrook E H
Bought by
Pla Larry and Pla Paula
Home Financials for this Owner
Home Financials are based on the most recent Mortgage that was taken out on this home.
Original Mortgage
$105,300
Interest Rate
7.91%
Create a Home Valuation Report for This Property
The Home Valuation Report is an in-depth analysis detailing your home's value as well as a comparison with similar homes in the area
Home Values in the Area
Average Home Value in this Area
Purchase History
| Date | Buyer | Sale Price | Title Company |
|---|---|---|---|
| Ehlen Thomas S | -- | -- | |
| Tucker E Glenn | $255,000 | -- | |
| Pla Larry | $117,000 | -- |
Source: Public Records
Mortgage History
| Date | Status | Borrower | Loan Amount |
|---|---|---|---|
| Open | Ehlen Thomas S | $525,000 | |
| Previous Owner | Tucker E Glenn | $200,000 | |
| Previous Owner | Pla Larry | $105,300 |
Source: Public Records
Tax History Compared to Growth
Tax History
| Year | Tax Paid | Tax Assessment Tax Assessment Total Assessment is a certain percentage of the fair market value that is determined by local assessors to be the total taxable value of land and additions on the property. | Land | Improvement |
|---|---|---|---|---|
| 2025 | $9,088 | $1,035,260 | -- | -- |
| 2024 | $9,066 | $1,006,084 | -- | -- |
| 2023 | $9,066 | $976,781 | $0 | $0 |
| 2022 | $9,451 | $948,331 | $0 | $0 |
| 2021 | $9,770 | $920,710 | $0 | $0 |
| 2020 | $9,581 | $907,998 | $0 | $0 |
| 2019 | $9,529 | $887,584 | $0 | $0 |
| 2018 | $9,365 | $871,034 | $0 | $0 |
| 2017 | $9,277 | $853,119 | $0 | $0 |
| 2016 | $9,183 | $835,572 | $0 | $0 |
| 2015 | $9,369 | $829,764 | $0 | $0 |
| 2014 | $9,395 | $773,179 | $0 | $0 |
Source: Public Records
Map
Nearby Homes