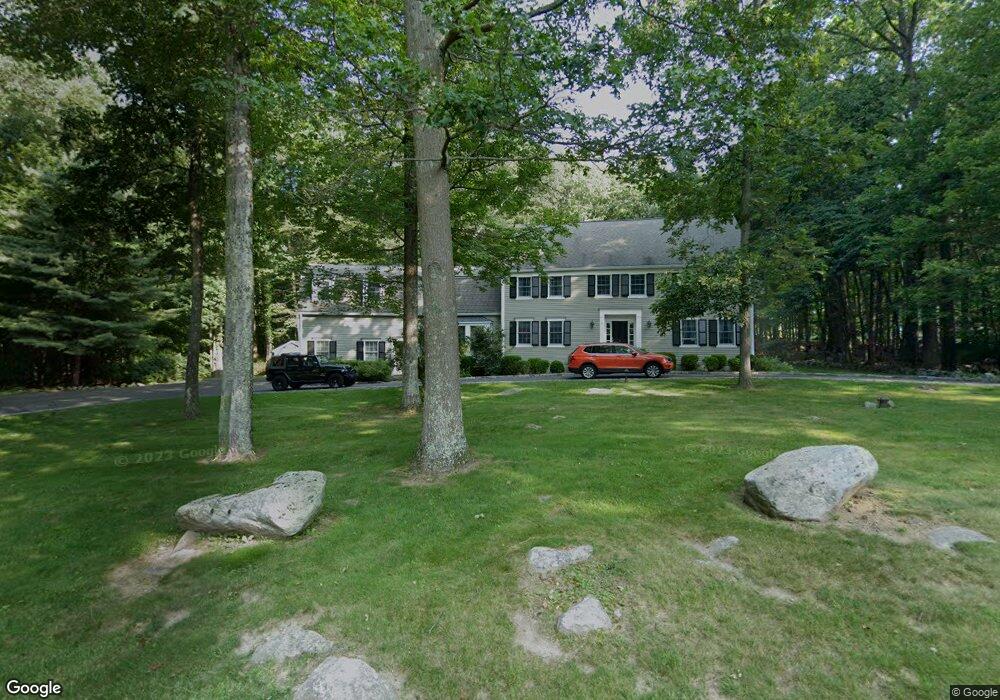
10 Acorn Place Ridgefield, CT 06877
Estimated Value: $1,399,000 - $1,642,000
4
Beds
4
Baths
4,485
Sq Ft
$342/Sq Ft
Est. Value
About This Home
This home is located at 10 Acorn Place, Ridgefield, CT 06877 and is currently estimated at $1,532,215, approximately $341 per square foot. 10 Acorn Place is a home located in Fairfield County with nearby schools including Branchville Elementary School, Ridgefield High School, and St. Mary School.
Ownership History
Date
Name
Owned For
Owner Type
Purchase Details
Closed on
Jan 26, 2022
Sold by
Irving Andrew
Bought by
Irving Andrew
Current Estimated Value
Home Financials for this Owner
Home Financials are based on the most recent Mortgage that was taken out on this home.
Original Mortgage
$720,000
Outstanding Balance
$660,738
Interest Rate
2.63%
Mortgage Type
Adjustable Rate Mortgage/ARM
Estimated Equity
$871,477
Purchase Details
Closed on
Jul 30, 2004
Sold by
Samenuk George and Samenuk Ann
Bought by
Dowd Sean and Dowd Jacoueline M
Purchase Details
Closed on
Nov 1, 2000
Sold by
Maloney John P and Maloney Susan B
Bought by
Dowd Sean and Dowd Mcconnell-Dowd J
Purchase Details
Closed on
Jun 30, 1993
Sold by
Nawsbank Inc
Bought by
Maloney John and Maloney Susan
Purchase Details
Closed on
Sep 29, 1988
Sold by
Bradley Terry
Bought by
Dye James
Create a Home Valuation Report for This Property
The Home Valuation Report is an in-depth analysis detailing your home's value as well as a comparison with similar homes in the area
Home Values in the Area
Average Home Value in this Area
Purchase History
| Date | Buyer | Sale Price | Title Company |
|---|---|---|---|
| Irving Andrew | -- | None Available | |
| Irving Andrew | -- | None Available | |
| Dowd Sean | $1,895,000 | -- | |
| Dowd Sean | $746,000 | -- | |
| Maloney John | $462,500 | -- | |
| Dowd Sean | $1,895,000 | -- | |
| Dowd Sean | $746,000 | -- | |
| Maloney John | $462,500 | -- | |
| Dye James | $535,000 | -- |
Source: Public Records
Mortgage History
| Date | Status | Borrower | Loan Amount |
|---|---|---|---|
| Open | Irving Andrew | $720,000 | |
| Closed | Irving Andrew | $720,000 | |
| Previous Owner | Dye James | $792,000 |
Source: Public Records
Tax History Compared to Growth
Tax History
| Year | Tax Paid | Tax Assessment Tax Assessment Total Assessment is a certain percentage of the fair market value that is determined by local assessors to be the total taxable value of land and additions on the property. | Land | Improvement |
|---|---|---|---|---|
| 2025 | $17,382 | $634,620 | $280,000 | $354,620 |
| 2024 | $16,722 | $634,620 | $280,000 | $354,620 |
| 2023 | $16,380 | $634,620 | $280,000 | $354,620 |
| 2022 | $16,276 | $572,510 | $210,010 | $362,500 |
| 2021 | $16,151 | $572,510 | $210,010 | $362,500 |
| 2020 | $16,099 | $572,510 | $210,010 | $362,500 |
| 2019 | $16,099 | $572,510 | $210,010 | $362,500 |
| 2018 | $15,904 | $572,510 | $210,010 | $362,500 |
| 2017 | $15,103 | $555,040 | $203,280 | $351,760 |
| 2016 | $14,814 | $555,040 | $203,280 | $351,760 |
| 2015 | $14,437 | $555,040 | $203,280 | $351,760 |
| 2014 | $14,437 | $555,040 | $203,280 | $351,760 |
Source: Public Records
Map
Nearby Homes
- 258 Silver Spring Rd
- 131 Fieldcrest Dr
- 23 Silver Hill Rd
- 136 Elmwood Rd
- 75 Saint Johns Rd
- 87 Silver Hill Rd
- 164 Wilton Rd W
- 160 Wilton Rd W
- 12 Stonewall Ct
- 10 Silvermine Dr
- 145 Smith Ridge Rd
- 247 Smith Ridge Rd
- 26 Elmwood Rd
- 27 Country Club Rd
- 384 West Ln
- 212 Elmwood Rd
- 19 Ledgewood Ln
- 84 Olmstead Ln
- 94 Soundview Rd
- Lot 6 Cattle Pen Ln
- 11 Acorn Place
- 26 Acorn Place
- 84 Silver Spring Rd
- 95 Silver Spring Rd
- 25 Acorn Place
- 62 Silver Spring Rd
- 64 Silver Spring Rd
- 49 Silver Spring Rd
- 52 Silver Spring Rd
- 100 Silver Spring Rd
- 80 Silver Spring Rd
- 54 Silver Spring Rd
- 104 Silver Spring Rd
- 54 S Ridge Ct
- 36 Acorn Place
- 45 Silver Spring Rd
- 56 Silver Spring Rd
- 35 Acorn Place
- 58 Silver Spring Rd
- 116 Silver Spring Rd