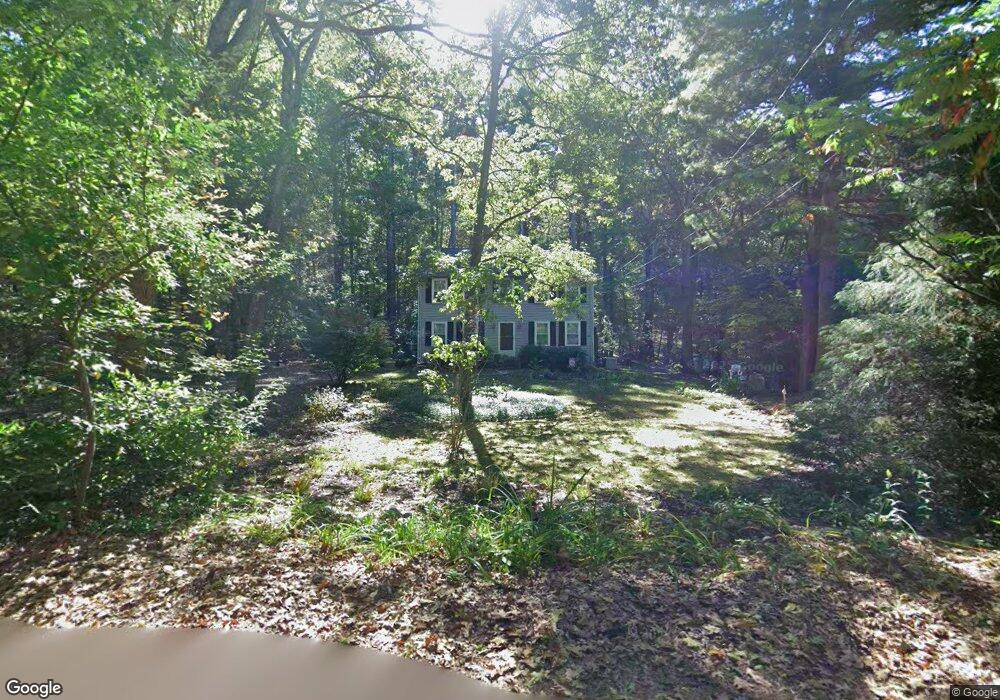
10 Acorn Rd Wrentham, MA 02093
Sheldonville NeighborhoodEstimated Value: $696,046 - $748,000
3
Beds
3
Baths
1,632
Sq Ft
$437/Sq Ft
Est. Value
About This Home
This home is located at 10 Acorn Rd, Wrentham, MA 02093 and is currently estimated at $713,012, approximately $436 per square foot. 10 Acorn Rd is a home located in Norfolk County with nearby schools including Delaney Elementary School and Charles E Roderick.
Ownership History
Date
Name
Owned For
Owner Type
Purchase Details
Closed on
Jul 21, 1995
Sold by
Brothers Rt
Bought by
Lehan Thomas E
Current Estimated Value
Home Financials for this Owner
Home Financials are based on the most recent Mortgage that was taken out on this home.
Original Mortgage
$140,000
Interest Rate
7.49%
Mortgage Type
Purchase Money Mortgage
Create a Home Valuation Report for This Property
The Home Valuation Report is an in-depth analysis detailing your home's value as well as a comparison with similar homes in the area
Home Values in the Area
Average Home Value in this Area
Purchase History
| Date | Buyer | Sale Price | Title Company |
|---|---|---|---|
| Lehan Thomas E | $175,000 | -- |
Source: Public Records
Mortgage History
| Date | Status | Borrower | Loan Amount |
|---|---|---|---|
| Open | Lehan Thomas E | $200,000 | |
| Closed | Lehan Thomas E | $85,000 | |
| Closed | Lehan Thomas E | $140,000 | |
| Previous Owner | Lehan Thomas E | $100,000 |
Source: Public Records
Tax History Compared to Growth
Tax History
| Year | Tax Paid | Tax Assessment Tax Assessment Total Assessment is a certain percentage of the fair market value that is determined by local assessors to be the total taxable value of land and additions on the property. | Land | Improvement |
|---|---|---|---|---|
| 2025 | $7,007 | $604,600 | $322,600 | $282,000 |
| 2024 | $6,874 | $572,800 | $322,600 | $250,200 |
| 2023 | $6,441 | $510,400 | $293,400 | $217,000 |
| 2022 | $5,800 | $424,300 | $233,700 | $190,600 |
| 2021 | $5,257 | $373,600 | $198,000 | $175,600 |
| 2020 | $5,047 | $354,200 | $163,900 | $190,300 |
| 2019 | $4,881 | $345,700 | $163,900 | $181,800 |
| 2018 | $4,594 | $322,600 | $163,700 | $158,900 |
| 2017 | $4,342 | $304,700 | $160,600 | $144,100 |
| 2016 | $4,245 | $297,300 | $155,900 | $141,400 |
| 2015 | $4,131 | $275,800 | $149,900 | $125,900 |
| 2014 | $4,065 | $265,500 | $144,200 | $121,300 |
Source: Public Records
Map
Nearby Homes
- 440 Chestnut St
- 80 Carriage House Ln
- 955 Summer St
- 50 Green St
- 6 Woodchester Rd
- 791 South St Unit 5
- 1204 South St
- 0 Fall Ln
- 1222 South St
- Lot 1 - Blueberry 2 Car Plan at King Philip Estates
- Lot 8 - Blueberry 2 Car Plan at King Philip Estates
- Lot 5 - Hughes 2 car Plan at King Philip Estates
- Lot 6 - Blueberry 3 Car Plan at King Philip Estates
- Lot 2 - Camden 2 Car Plan at King Philip Estates
- Lot 7 - Cedar Plan at King Philip Estates
- Lot 4 - Hemingway 2 Car Plan at King Philip Estates
- Lot 3 - Blueberry 2 Car Plan at King Philip Estates
- 55 Lawrence Dr Unit 55
- Lot 3 - 14 Earle Stewart Ln
- 19 Chestnut Lot 0