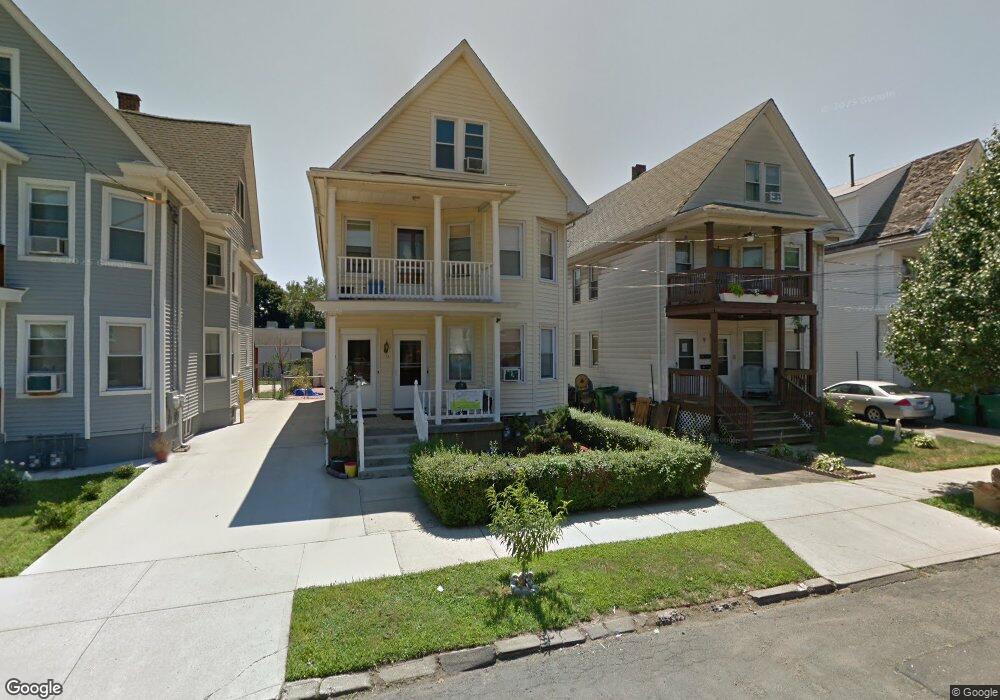
10 Alling St West Haven, CT 06516
Allingtown NeighborhoodEstimated Value: $438,072 - $507,000
4
Beds
2
Baths
2,859
Sq Ft
$165/Sq Ft
Est. Value
About This Home
This home is located at 10 Alling St, West Haven, CT 06516 and is currently estimated at $470,518, approximately $164 per square foot. 10 Alling St is a home located in New Haven County with nearby schools including Carrigan 5/6 Intermediate School, Harry M. Bailey Middle School, and West Haven High School.
Ownership History
Date
Name
Owned For
Owner Type
Purchase Details
Closed on
May 18, 2018
Sold by
Bueno-Perez Jose M and Montiel Maria G
Bought by
Carias-Salazar Odsman
Current Estimated Value
Home Financials for this Owner
Home Financials are based on the most recent Mortgage that was taken out on this home.
Original Mortgage
$260,200
Outstanding Balance
$224,041
Interest Rate
4.4%
Mortgage Type
FHA
Estimated Equity
$246,477
Purchase Details
Closed on
Jan 13, 2005
Sold by
Mangione Paul
Bought by
Bueno-Perez Jose M
Home Financials for this Owner
Home Financials are based on the most recent Mortgage that was taken out on this home.
Original Mortgage
$210,400
Interest Rate
5.81%
Mortgage Type
Purchase Money Mortgage
Purchase Details
Closed on
Apr 4, 2003
Sold by
Mazzara Josephine
Bought by
Mangione Paw
Create a Home Valuation Report for This Property
The Home Valuation Report is an in-depth analysis detailing your home's value as well as a comparison with similar homes in the area
Home Values in the Area
Average Home Value in this Area
Purchase History
| Date | Buyer | Sale Price | Title Company |
|---|---|---|---|
| Carias-Salazar Odsman | $265,000 | -- | |
| Carias-Salazar Odsman | $265,000 | -- | |
| Bueno-Perez Jose M | $217,000 | -- | |
| Bueno-Perez Jose M | $217,000 | -- | |
| Mangione Paw | $87,000 | -- | |
| Mangione Paw | $87,000 | -- |
Source: Public Records
Mortgage History
| Date | Status | Borrower | Loan Amount |
|---|---|---|---|
| Open | Mangione Paw | $260,200 | |
| Closed | Mangione Paw | $260,200 | |
| Previous Owner | Mangione Paw | $210,400 |
Source: Public Records
Tax History Compared to Growth
Tax History
| Year | Tax Paid | Tax Assessment Tax Assessment Total Assessment is a certain percentage of the fair market value that is determined by local assessors to be the total taxable value of land and additions on the property. | Land | Improvement |
|---|---|---|---|---|
| 2025 | $9,366 | $271,250 | $58,520 | $212,730 |
| 2024 | $8,854 | $182,490 | $40,530 | $141,960 |
| 2023 | $8,488 | $182,490 | $40,530 | $141,960 |
| 2022 | $8,322 | $182,490 | $40,530 | $141,960 |
| 2021 | $8,322 | $182,490 | $40,530 | $141,960 |
| 2020 | $7,461 | $147,840 | $32,620 | $115,220 |
| 2019 | $7,195 | $147,840 | $32,620 | $115,220 |
| 2018 | $7,133 | $147,840 | $32,620 | $115,220 |
| 2017 | $6,750 | $147,840 | $32,620 | $115,220 |
| 2016 | $6,736 | $147,840 | $32,620 | $115,220 |
| 2015 | $6,327 | $156,800 | $36,330 | $120,470 |
| 2014 | $6,288 | $156,800 | $36,330 | $120,470 |
Source: Public Records
Map
Nearby Homes
- 897 1st Ave
- 155 Lamson St
- 57 Alling Street Extension
- 93 Spring St
- 43 Clifton St
- 14 Homestead Ave
- 104 Terrace Ave
- 14 Ely St
- 22 Thill St
- 161 W Spring St Unit B2
- 81 Homeside Ave
- 170 Wood St
- 49 Glade St Unit A4
- 38 Chauncey St
- 677 Washington Ave
- 194 Homeside Ave
- 524 1st Ave
- 47,47R,63,65R Coleman St
- 70 Coleman St
- 194 Ella T Grasso Blvd