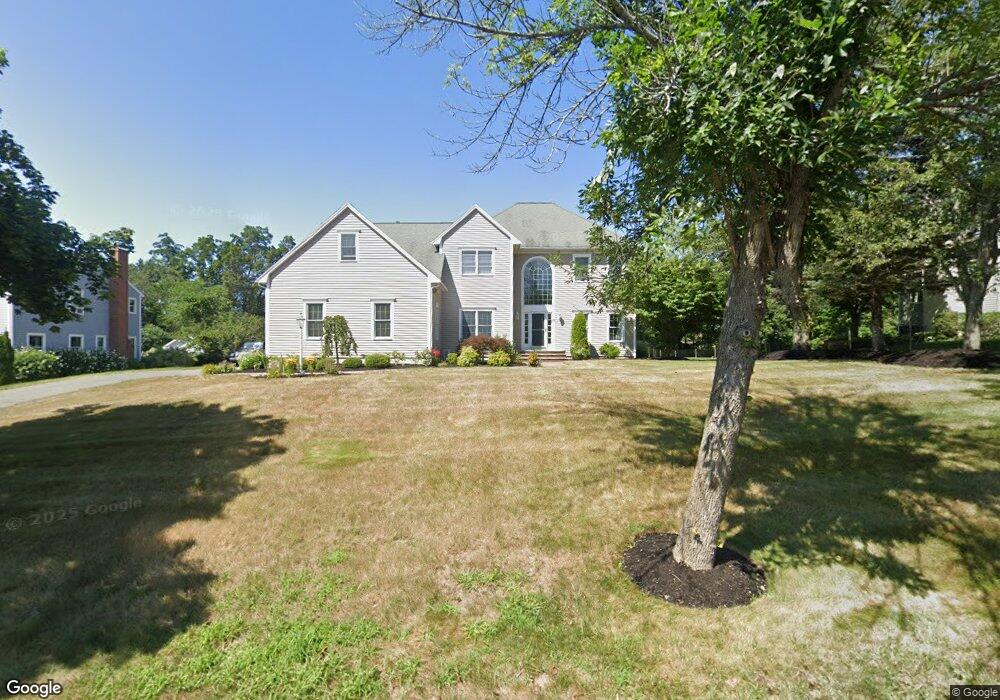
10 Anna Dr Danvers, MA 01923
Estimated Value: $1,030,251 - $1,374,000
4
Beds
3
Baths
2,928
Sq Ft
$398/Sq Ft
Est. Value
About This Home
This home is located at 10 Anna Dr, Danvers, MA 01923 and is currently estimated at $1,164,563, approximately $397 per square foot. 10 Anna Dr is a home located in Essex County with nearby schools including Danvers High School, St. Mary of the Annunciation School, and Plumfield Academy.
Ownership History
Date
Name
Owned For
Owner Type
Purchase Details
Closed on
Oct 11, 2024
Sold by
Odonnell Deborah A and Odonnell Michael W
Bought by
Deborah A Odonnell T A and Deborah Odonnell
Current Estimated Value
Purchase Details
Closed on
Sep 19, 1995
Sold by
Dayton Street Dev Corp
Bought by
Odonnell Michael W and Odonell Deborah
Create a Home Valuation Report for This Property
The Home Valuation Report is an in-depth analysis detailing your home's value as well as a comparison with similar homes in the area
Home Values in the Area
Average Home Value in this Area
Purchase History
| Date | Buyer | Sale Price | Title Company |
|---|---|---|---|
| Deborah A Odonnell T A | -- | None Available | |
| Deborah A Odonnell T A | -- | None Available | |
| Odonnell Michael W | $125,000 | -- | |
| Odonnell Michael W | $125,000 | -- |
Source: Public Records
Mortgage History
| Date | Status | Borrower | Loan Amount |
|---|---|---|---|
| Previous Owner | Odonnell Michael W | $100,000 | |
| Previous Owner | Odonnell Michael W | $168,500 | |
| Previous Owner | Odonnell Michael W | $100,000 |
Source: Public Records
Tax History
| Year | Tax Paid | Tax Assessment Tax Assessment Total Assessment is a certain percentage of the fair market value that is determined by local assessors to be the total taxable value of land and additions on the property. | Land | Improvement |
|---|---|---|---|---|
| 2025 | $10,975 | $998,600 | $465,300 | $533,300 |
| 2024 | $10,841 | $975,800 | $465,300 | $510,500 |
| 2023 | $10,743 | $914,300 | $432,300 | $482,000 |
| 2022 | $10,398 | $821,300 | $375,300 | $446,000 |
| 2021 | $9,802 | $734,200 | $345,300 | $388,900 |
| 2020 | $9,295 | $711,700 | $322,800 | $388,900 |
| 2019 | $9,292 | $699,700 | $322,800 | $376,900 |
| 2018 | $9,096 | $671,800 | $319,800 | $352,000 |
| 2017 | $8,696 | $612,800 | $285,300 | $327,500 |
| 2016 | $8,570 | $603,500 | $285,300 | $318,200 |
| 2015 | $8,393 | $562,900 | $262,800 | $300,100 |
Source: Public Records
Map
Nearby Homes
- 98 Newbury St Unit 18B
- 98 Newbury St Unit 23B
- 103 Newbury St Unit 1
- 37 Peaslee Cir Unit 37
- 102 Centre St
- 6 Greystone Dr
- 10 Oak St
- 11 Spring St
- 20 Bellingham Ct
- 1 Mills Point Unit 1
- 19 Peachey Cir
- 40 Village Rd Unit 1210
- 40 Village Rd Unit 1006
- 35 East St
- 38 Village Rd Unit 515
- 36 Village Rd Unit 603
- 36 Village Rd Unit 506
- 5 Wennerberg Rd
- 67 Fuller Pond Rd
- 286 Newbury St Unit 110
Your Personal Tour Guide
Ask me questions while you tour the home.