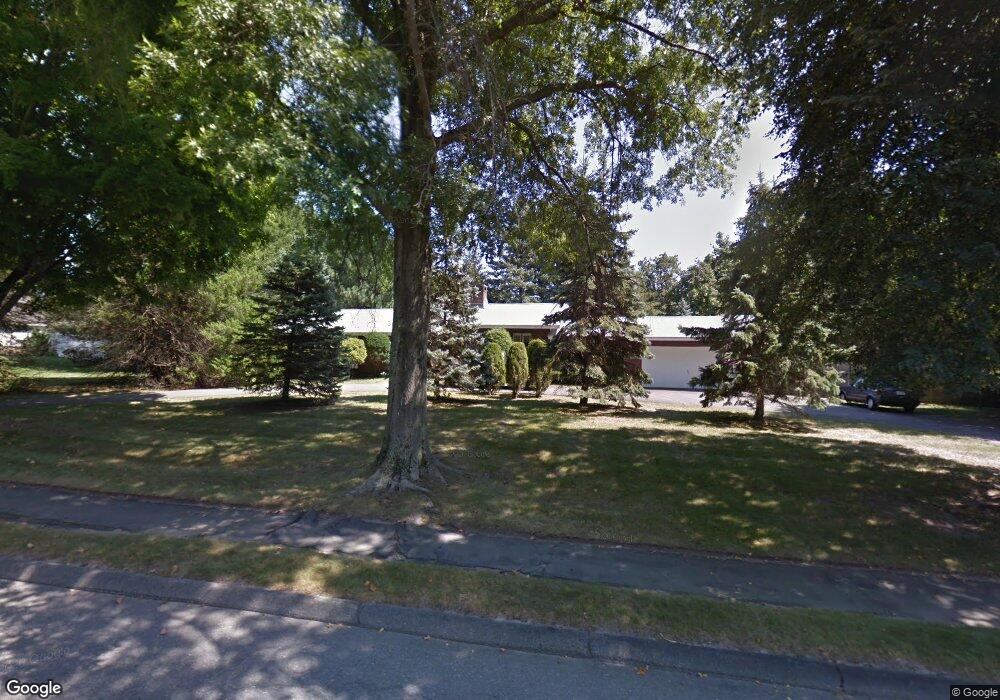
10 Apple Hill Ln Lynnfield, MA 01940
Estimated Value: $830,000 - $2,477,000
3
Beds
2
Baths
1,456
Sq Ft
$895/Sq Ft
Est. Value
About This Home
This home is located at 10 Apple Hill Ln, Lynnfield, MA 01940 and is currently estimated at $1,302,408, approximately $894 per square foot. 10 Apple Hill Ln is a home located in Essex County with nearby schools including Lynnfield Middle School, Pickering Middle School, and Lynnfield High School.
Ownership History
Date
Name
Owned For
Owner Type
Purchase Details
Closed on
Mar 25, 2024
Sold by
Lampropoulos Chris
Bought by
Lampropoulos Chris and Lampropoulos Demetrios
Current Estimated Value
Purchase Details
Closed on
Jul 29, 2022
Sold by
Costa John J
Bought by
Costa Ft and Costa
Purchase Details
Closed on
Jul 11, 2011
Sold by
Costa John J
Bought by
Costa John J and Costa Linda J
Purchase Details
Closed on
Feb 15, 1965
Bought by
Costa John J and Costa Linda J
Create a Home Valuation Report for This Property
The Home Valuation Report is an in-depth analysis detailing your home's value as well as a comparison with similar homes in the area
Home Values in the Area
Average Home Value in this Area
Purchase History
| Date | Buyer | Sale Price | Title Company |
|---|---|---|---|
| Lampropoulos Chris | -- | None Available | |
| Costa Ft | -- | None Available | |
| Costa John J | -- | -- | |
| Costa John J | -- | -- |
Source: Public Records
Tax History Compared to Growth
Tax History
| Year | Tax Paid | Tax Assessment Tax Assessment Total Assessment is a certain percentage of the fair market value that is determined by local assessors to be the total taxable value of land and additions on the property. | Land | Improvement |
|---|---|---|---|---|
| 2025 | $8,496 | $804,500 | $766,000 | $38,500 |
| 2024 | $10,554 | $1,004,200 | $743,700 | $260,500 |
| 2023 | $10,173 | $900,300 | $658,700 | $241,600 |
| 2022 | $9,925 | $827,800 | $616,200 | $211,600 |
| 2021 | $9,448 | $712,000 | $510,000 | $202,000 |
| 2020 | $9,261 | $665,300 | $463,300 | $202,000 |
| 2019 | $8,869 | $637,600 | $435,600 | $202,000 |
| 2018 | $8,643 | $628,100 | $435,600 | $192,500 |
| 2017 | $8,655 | $628,100 | $435,600 | $192,500 |
| 2016 | $8,987 | $619,800 | $435,600 | $184,200 |
| 2015 | $8,236 | $568,400 | $391,900 | $176,500 |
Source: Public Records
Map
Nearby Homes
- 16 W Tapley Rd
- 33 Wing Rd
- 6 Needham Rd
- 20 Pine Hill Rd
- 6 Ashley Ct
- 928 Main St
- 19 Fairway Ln
- 19 Fairway Ln Unit 53
- Beverly Plan at Willis Brook at Lynnfield
- Sutton Plan at Willis Brook at Lynnfield
- Topsfield Plan at Willis Brook at Lynnfield
- Westford Plan at Willis Brook at Lynnfield
- 1 Stableford Ct Unit 13
- 2 Bridle Path
- 11 Hutchins Cir
- 4 Lowell St
- 1466 Main St
- 70 Forest Hill Ave
- 35 Catherine Dr
- 62 Catherine Dr