10 Apple Ln West Bridgewater, MA 02379
Estimated Value: $641,000 - $758,000
5
Beds
4
Baths
2,528
Sq Ft
$274/Sq Ft
Est. Value
About This Home
This home is located at 10 Apple Ln, West Bridgewater, MA 02379 and is currently estimated at $693,685, approximately $274 per square foot. 10 Apple Ln is a home located in Plymouth County with nearby schools including Spring Street Elementary School, Howard Elementary School, and Rose L. MacDonald Elementary School.
Ownership History
Date
Name
Owned For
Owner Type
Purchase Details
Closed on
Feb 28, 2007
Sold by
Nelson John R and Nelson Ruth M
Bought by
Fuller Thomas A and Fuller Christy S
Current Estimated Value
Home Financials for this Owner
Home Financials are based on the most recent Mortgage that was taken out on this home.
Original Mortgage
$56,000
Interest Rate
6.33%
Purchase Details
Closed on
Sep 11, 1989
Sold by
Apple Orchard Rt
Bought by
Clark Donald A
Create a Home Valuation Report for This Property
The Home Valuation Report is an in-depth analysis detailing your home's value as well as a comparison with similar homes in the area
Home Values in the Area
Average Home Value in this Area
Purchase History
| Date | Buyer | Sale Price | Title Company |
|---|---|---|---|
| Fuller Thomas A | $370,000 | -- | |
| Clark Donald A | $85,000 | -- |
Source: Public Records
Mortgage History
| Date | Status | Borrower | Loan Amount |
|---|---|---|---|
| Open | Clark Donald A | $285,000 | |
| Closed | Clark Donald A | $56,000 | |
| Closed | Clark Donald A | $296,000 |
Source: Public Records
Tax History Compared to Growth
Tax History
| Year | Tax Paid | Tax Assessment Tax Assessment Total Assessment is a certain percentage of the fair market value that is determined by local assessors to be the total taxable value of land and additions on the property. | Land | Improvement |
|---|---|---|---|---|
| 2025 | $8,854 | $647,700 | $235,900 | $411,800 |
| 2024 | $8,641 | $609,800 | $215,200 | $394,600 |
| 2023 | $8,218 | $534,700 | $192,400 | $342,300 |
| 2022 | $8,058 | $496,800 | $184,100 | $312,700 |
| 2021 | $7,865 | $470,700 | $184,100 | $286,600 |
| 2020 | $7,920 | $483,800 | $184,100 | $299,700 |
| 2019 | $7,824 | $473,300 | $184,100 | $289,200 |
| 2018 | $7,623 | $445,800 | $165,500 | $280,300 |
| 2017 | $7,567 | $426,800 | $155,200 | $271,600 |
| 2016 | $7,495 | $416,400 | $144,800 | $271,600 |
| 2015 | $7,256 | $407,400 | $144,800 | $262,600 |
| 2014 | $6,687 | $405,500 | $144,800 | $260,700 |
Source: Public Records
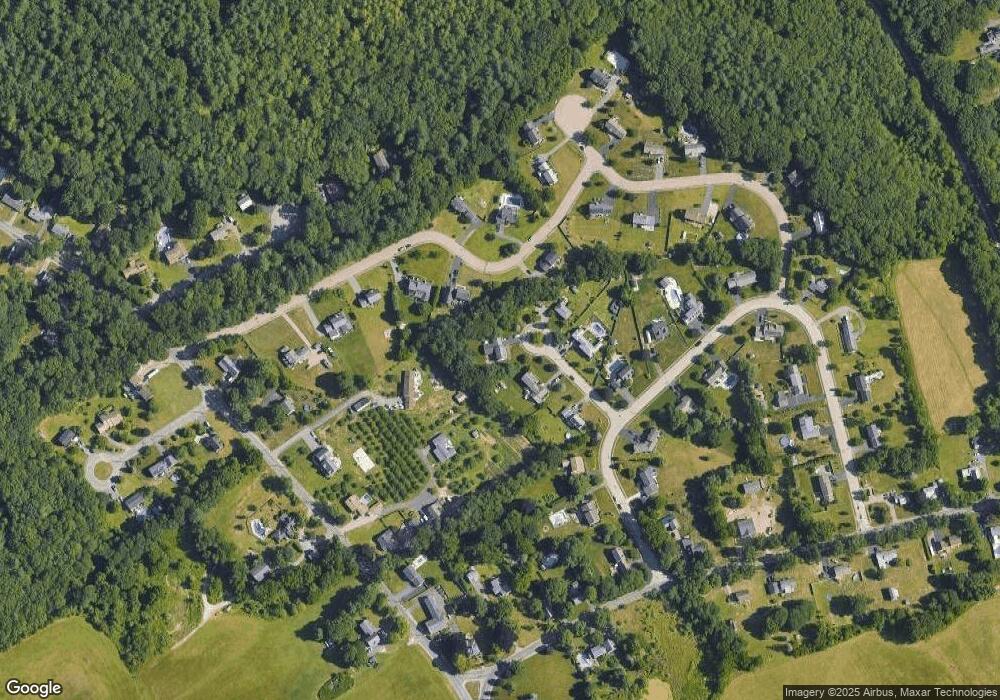
Map
Nearby Homes
- 9 Rising Sun Ln
- 6 Apple Ln
- 1 Parkers Way
- 120 East St
- 7 Rising Sun Ln
- 9 Apple Ln
- 11 Rising Sun Ln
- 5 Rising Sun Ln
- 5 Rising Sun Ln Unit 5
- 5 Rising Sun Ln Unit 1
- 2 Apple Ln
- 5 Apple Ln
- 12 Rising Sun Ln
- 3 Parkers Way
- 3 Rising Sun Ln
- 14 Orchard Dr
- 10 Orchard Dr
- 10 Rising Sun Ln
- 8 Elizabeth Ln
- 18 Orchard Dr