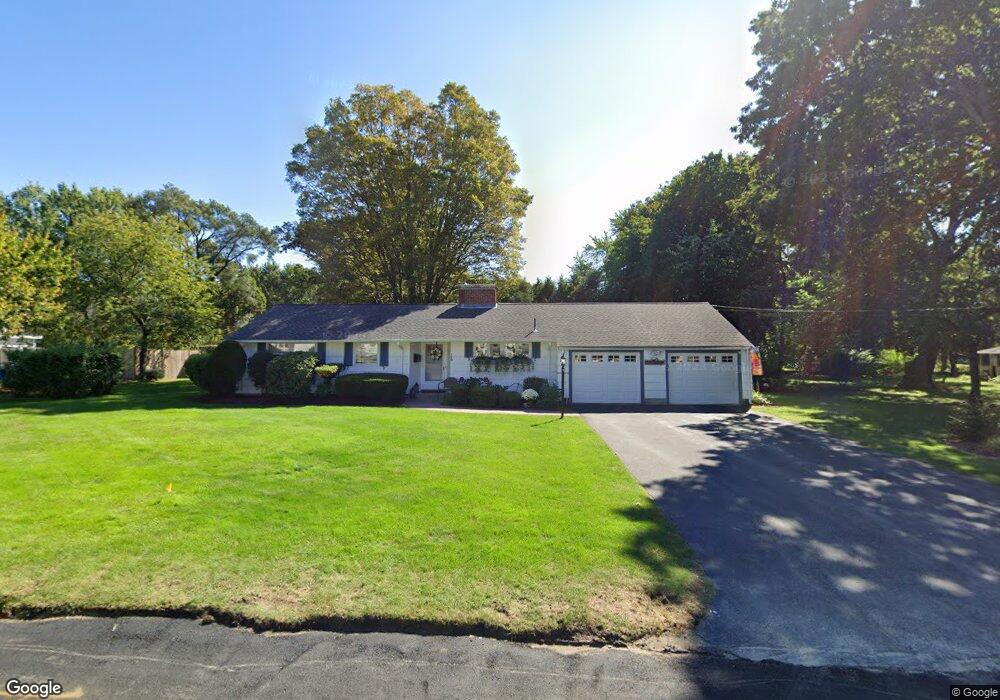
10 Appletree Ln Lexington, MA 02420
Countryside NeighborhoodEstimated Value: $1,433,589 - $1,545,000
3
Beds
2
Baths
1,708
Sq Ft
$882/Sq Ft
Est. Value
About This Home
This home is located at 10 Appletree Ln, Lexington, MA 02420 and is currently estimated at $1,506,147, approximately $881 per square foot. 10 Appletree Ln is a home located in Middlesex County with nearby schools including Harrington Elementary School, Jonas Clarke Middle School, and Lexington High School.
Ownership History
Date
Name
Owned For
Owner Type
Purchase Details
Closed on
Nov 28, 2023
Sold by
Morgan J Brady Jr Ret and Petroff
Bought by
Kx Int and Kx Xu
Current Estimated Value
Home Financials for this Owner
Home Financials are based on the most recent Mortgage that was taken out on this home.
Original Mortgage
$993,750
Outstanding Balance
$973,273
Interest Rate
7.57%
Mortgage Type
Purchase Money Mortgage
Estimated Equity
$532,874
Purchase Details
Closed on
Feb 4, 2005
Sold by
Brady Carole J and Brady Morgan J
Bought by
Morgan J Brady Jr Ret and Brady
Purchase Details
Closed on
Jan 1, 1962
Bought by
Brady Morgan J
Create a Home Valuation Report for This Property
The Home Valuation Report is an in-depth analysis detailing your home's value as well as a comparison with similar homes in the area
Home Values in the Area
Average Home Value in this Area
Purchase History
| Date | Buyer | Sale Price | Title Company |
|---|---|---|---|
| Kx Int | $1,400,000 | None Available | |
| Morgan J Brady Jr Ret | -- | -- | |
| Morgan J Brady Jr Ret | -- | -- | |
| Brady Morgan J | -- | -- |
Source: Public Records
Mortgage History
| Date | Status | Borrower | Loan Amount |
|---|---|---|---|
| Open | Kx Int | $993,750 | |
| Previous Owner | Brady Morgan J | $150,000 |
Source: Public Records
Tax History
| Year | Tax Paid | Tax Assessment Tax Assessment Total Assessment is a certain percentage of the fair market value that is determined by local assessors to be the total taxable value of land and additions on the property. | Land | Improvement |
|---|---|---|---|---|
| 2025 | $14,126 | $1,155,000 | $729,000 | $426,000 |
| 2024 | $12,863 | $1,050,000 | $694,000 | $356,000 |
| 2023 | $12,922 | $994,000 | $631,000 | $363,000 |
| 2022 | $12,282 | $890,000 | $574,000 | $316,000 |
| 2021 | $3,860 | $835,000 | $546,000 | $289,000 |
| 2020 | $11,647 | $829,000 | $546,000 | $283,000 |
| 2019 | $12,995 | $776,000 | $521,000 | $255,000 |
| 2018 | $10,511 | $735,000 | $496,000 | $239,000 |
| 2017 | $10,505 | $725,000 | $457,000 | $268,000 |
| 2016 | $10,278 | $704,000 | $435,000 | $269,000 |
| 2015 | $9,377 | $631,000 | $396,000 | $235,000 |
| 2014 | $8,980 | $579,000 | $352,000 | $227,000 |
Source: Public Records
Map
Nearby Homes
Your Personal Tour Guide
Ask me questions while you tour the home.