Estimated Value: $201,000 - $271,000
3
Beds
1
Bath
960
Sq Ft
$238/Sq Ft
Est. Value
About This Home
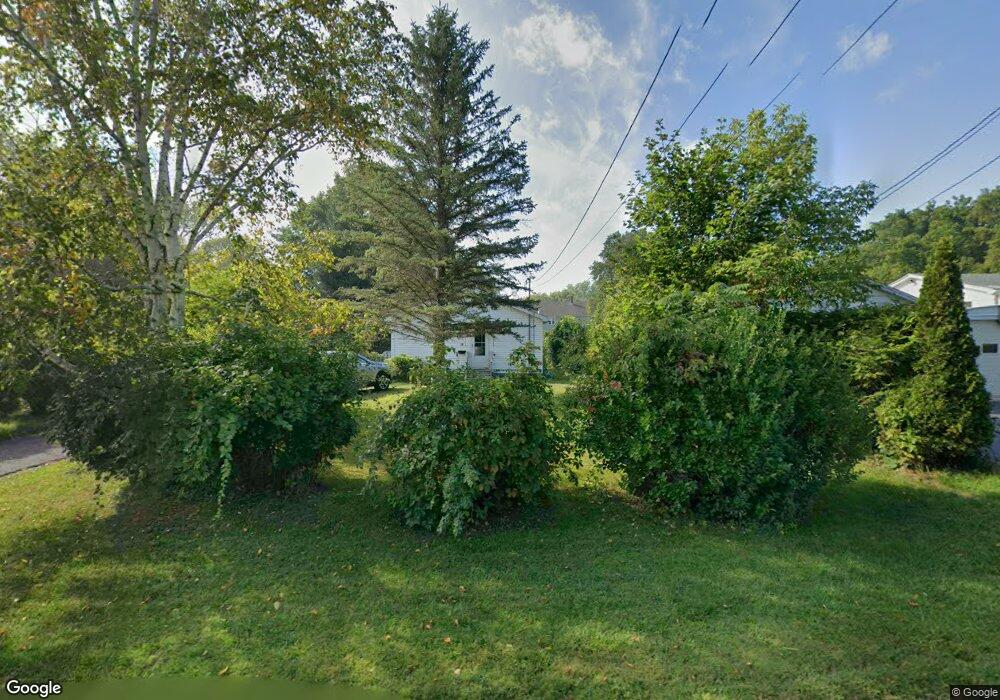
This home is located at 10 Apremont St, Adams, MA 01220 and is currently estimated at $228,105, approximately $237 per square foot. 10 Apremont St is a home located in Berkshire County with nearby schools including Hoosac Valley Middle & High School, Berkshire Arts & Technology Charter Public School, and St. Stanislaus Kostka School.
Ownership History
Date
Name
Owned For
Owner Type
Purchase Details
Closed on
Jul 7, 1994
Sold by
Salvato Bruce M and Salvato Christine J
Bought by
Riordan Dana J
Current Estimated Value
Home Financials for this Owner
Home Financials are based on the most recent Mortgage that was taken out on this home.
Original Mortgage
$70,380
Interest Rate
8.51%
Mortgage Type
Purchase Money Mortgage
Create a Home Valuation Report for This Property
The Home Valuation Report is an in-depth analysis detailing your home's value as well as a comparison with similar homes in the area
Home Values in the Area
Average Home Value in this Area
Purchase History
| Date | Buyer | Sale Price | Title Company |
|---|---|---|---|
| Riordan Dana J | $70,000 | -- |
Source: Public Records
Mortgage History
| Date | Status | Borrower | Loan Amount |
|---|---|---|---|
| Open | Riordan Dana J | $104,000 | |
| Closed | Riordan Dana J | $66,300 | |
| Closed | Riordan Dana J | $70,380 |
Source: Public Records
Tax History Compared to Growth
Tax History
| Year | Tax Paid | Tax Assessment Tax Assessment Total Assessment is a certain percentage of the fair market value that is determined by local assessors to be the total taxable value of land and additions on the property. | Land | Improvement |
|---|---|---|---|---|
| 2025 | $2,880 | $169,300 | $41,100 | $128,200 |
| 2024 | $2,713 | $154,700 | $38,600 | $116,100 |
| 2023 | $2,525 | $136,100 | $35,500 | $100,600 |
| 2022 | $2,455 | $117,500 | $30,800 | $86,700 |
| 2021 | $2,852 | $106,400 | $30,800 | $75,600 |
| 2020 | $2,332 | $106,600 | $30,900 | $75,700 |
| 2019 | $2,280 | $106,600 | $30,900 | $75,700 |
| 2018 | $2,381 | $107,200 | $30,900 | $76,300 |
| 2017 | $2,303 | $107,200 | $30,900 | $76,300 |
| 2016 | $2,156 | $100,800 | $30,900 | $69,900 |
| 2015 | $2,173 | $101,700 | $32,500 | $69,200 |
| 2014 | $2,029 | $101,700 | $32,500 | $69,200 |
Source: Public Records
Map
Nearby Homes