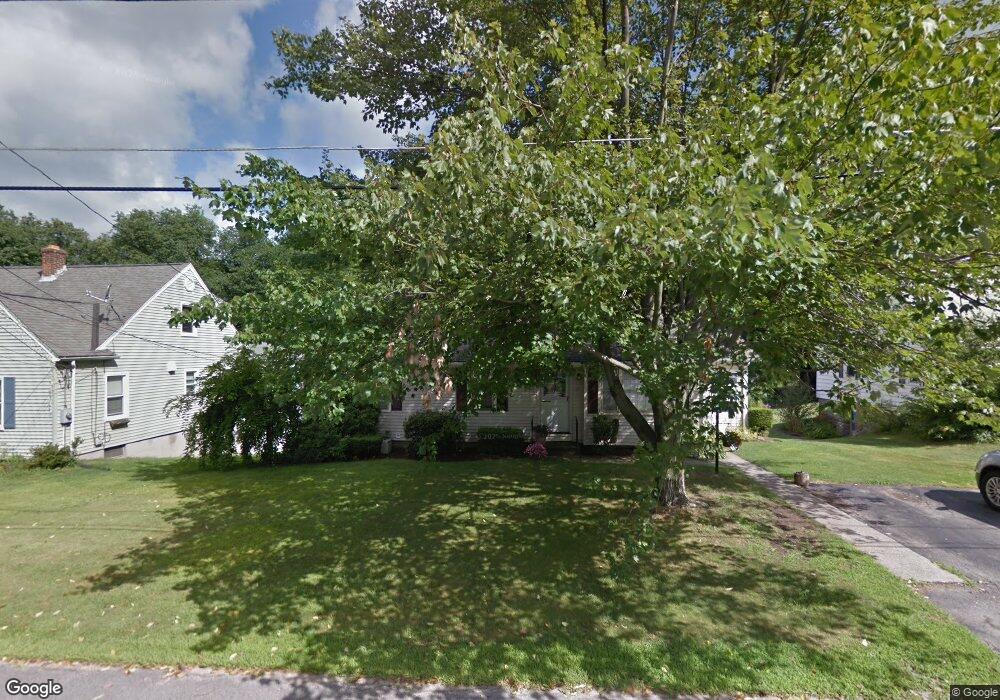
10 Ashcroft St Auburn, MA 01501
Stoneville NeighborhoodEstimated Value: $367,000 - $482,000
3
Beds
2
Baths
1,040
Sq Ft
$414/Sq Ft
Est. Value
About This Home
This home is located at 10 Ashcroft St, Auburn, MA 01501 and is currently estimated at $430,285, approximately $413 per square foot. 10 Ashcroft St is a home located in Worcester County with nearby schools including Auburn Senior High School and Shrewsbury Montessori School - Auburn Campus.
Ownership History
Date
Name
Owned For
Owner Type
Purchase Details
Closed on
May 27, 1999
Sold by
Adamick Chester J and Adamick Jennie A
Bought by
Levicki Michael A and Levicki Kristi
Current Estimated Value
Home Financials for this Owner
Home Financials are based on the most recent Mortgage that was taken out on this home.
Original Mortgage
$125,400
Interest Rate
6.82%
Mortgage Type
Purchase Money Mortgage
Create a Home Valuation Report for This Property
The Home Valuation Report is an in-depth analysis detailing your home's value as well as a comparison with similar homes in the area
Home Values in the Area
Average Home Value in this Area
Purchase History
| Date | Buyer | Sale Price | Title Company |
|---|---|---|---|
| Levicki Michael A | $132,000 | -- |
Source: Public Records
Mortgage History
| Date | Status | Borrower | Loan Amount |
|---|---|---|---|
| Open | Levicki Michael A | $164,000 | |
| Closed | Levicki Michael A | $36,502 | |
| Closed | Levicki Michael A | $125,400 |
Source: Public Records
Tax History Compared to Growth
Tax History
| Year | Tax Paid | Tax Assessment Tax Assessment Total Assessment is a certain percentage of the fair market value that is determined by local assessors to be the total taxable value of land and additions on the property. | Land | Improvement |
|---|---|---|---|---|
| 2025 | $54 | $376,900 | $127,100 | $249,800 |
| 2024 | $5,346 | $358,100 | $121,500 | $236,600 |
| 2023 | $5,144 | $323,900 | $110,400 | $213,500 |
| 2022 | $4,955 | $294,600 | $110,400 | $184,200 |
| 2021 | $4,720 | $260,200 | $97,500 | $162,700 |
| 2020 | $4,678 | $260,200 | $97,500 | $162,700 |
| 2019 | $4,380 | $237,800 | $96,500 | $141,300 |
| 2018 | $4,140 | $224,500 | $90,300 | $134,200 |
| 2017 | $3,963 | $216,100 | $81,900 | $134,200 |
| 2016 | $3,721 | $205,700 | $85,400 | $120,300 |
| 2015 | $3,455 | $200,200 | $85,400 | $114,800 |
| 2014 | $3,266 | $188,900 | $81,300 | $107,600 |
Source: Public Records
Map
Nearby Homes