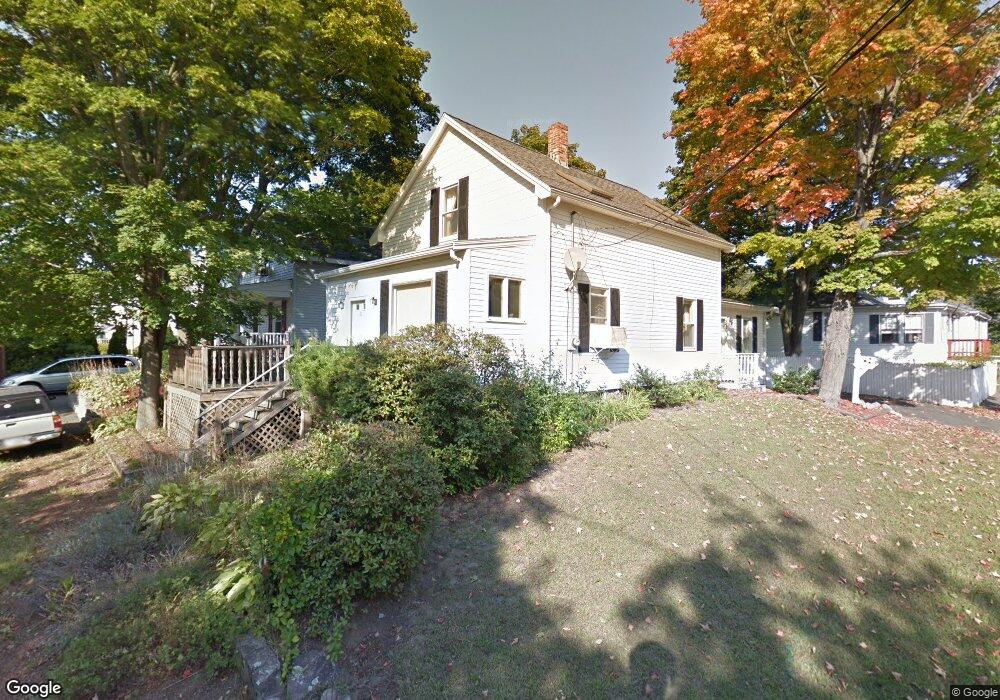
10 Barker St Danvers, MA 01923
Estimated Value: $603,000 - $667,000
3
Beds
3
Baths
1,374
Sq Ft
$462/Sq Ft
Est. Value
About This Home
This home is located at 10 Barker St, Danvers, MA 01923 and is currently estimated at $634,262, approximately $461 per square foot. 10 Barker St is a home located in Essex County with nearby schools including Danvers High School, St. Mary of the Annunciation School, and St. John's Prep.
Ownership History
Date
Name
Owned For
Owner Type
Purchase Details
Closed on
Jul 31, 1997
Sold by
Frankfort Peter S and Frankfort Susan B
Bought by
Coyne Margaret Ann
Current Estimated Value
Home Financials for this Owner
Home Financials are based on the most recent Mortgage that was taken out on this home.
Original Mortgage
$132,000
Interest Rate
7.55%
Mortgage Type
Purchase Money Mortgage
Purchase Details
Closed on
Sep 23, 1988
Sold by
Dansreau Lucien J
Bought by
Frankfort Peter S
Create a Home Valuation Report for This Property
The Home Valuation Report is an in-depth analysis detailing your home's value as well as a comparison with similar homes in the area
Home Values in the Area
Average Home Value in this Area
Purchase History
| Date | Buyer | Sale Price | Title Company |
|---|---|---|---|
| Coyne Margaret Ann | $165,000 | -- | |
| Frankfort Peter S | $153,800 | -- |
Source: Public Records
Mortgage History
| Date | Status | Borrower | Loan Amount |
|---|---|---|---|
| Open | Frankfort Peter S | $110,000 | |
| Closed | Frankfort Peter S | $125,000 | |
| Closed | Frankfort Peter S | $132,000 |
Source: Public Records
Tax History
| Year | Tax Paid | Tax Assessment Tax Assessment Total Assessment is a certain percentage of the fair market value that is determined by local assessors to be the total taxable value of land and additions on the property. | Land | Improvement |
|---|---|---|---|---|
| 2025 | $6,007 | $546,600 | $317,700 | $228,900 |
| 2024 | $6,011 | $541,000 | $317,700 | $223,300 |
| 2023 | $5,691 | $484,300 | $288,700 | $195,600 |
| 2022 | $5,606 | $442,800 | $262,000 | $180,800 |
| 2021 | $5,423 | $406,200 | $248,200 | $158,000 |
| 2020 | $5,267 | $403,300 | $245,300 | $158,000 |
| 2019 | $5,113 | $385,000 | $223,000 | $162,000 |
| 2018 | $4,861 | $359,000 | $220,700 | $138,300 |
| 2017 | $4,623 | $325,800 | $192,900 | $132,900 |
| 2016 | $4,442 | $312,800 | $183,900 | $128,900 |
| 2015 | $4,257 | $285,500 | $167,200 | $118,300 |
Source: Public Records
Map
Nearby Homes
- 14 Williams St Unit C17
- 43 Hobart St Unit B
- 10 Clark St
- 6 Venice St Unit B3
- 5 Holten St
- 22 Maple Ave
- 63 Adams St
- 35 High St Unit 3D
- 20 Central Ave
- 35 Locust St Unit 3
- 22 Collins St Unit 31
- 97 Sylvan St Unit 7
- 14 Chase St
- 2 Chapel Rd
- 11 Riverside Ave Unit 111
- 108 Abington Rd Unit 108
- 34 Bayview Terrace Unit 5
- 7 Riverbank Ave Unit 7
- 14 Grove St
- 147 High St
Your Personal Tour Guide
Ask me questions while you tour the home.