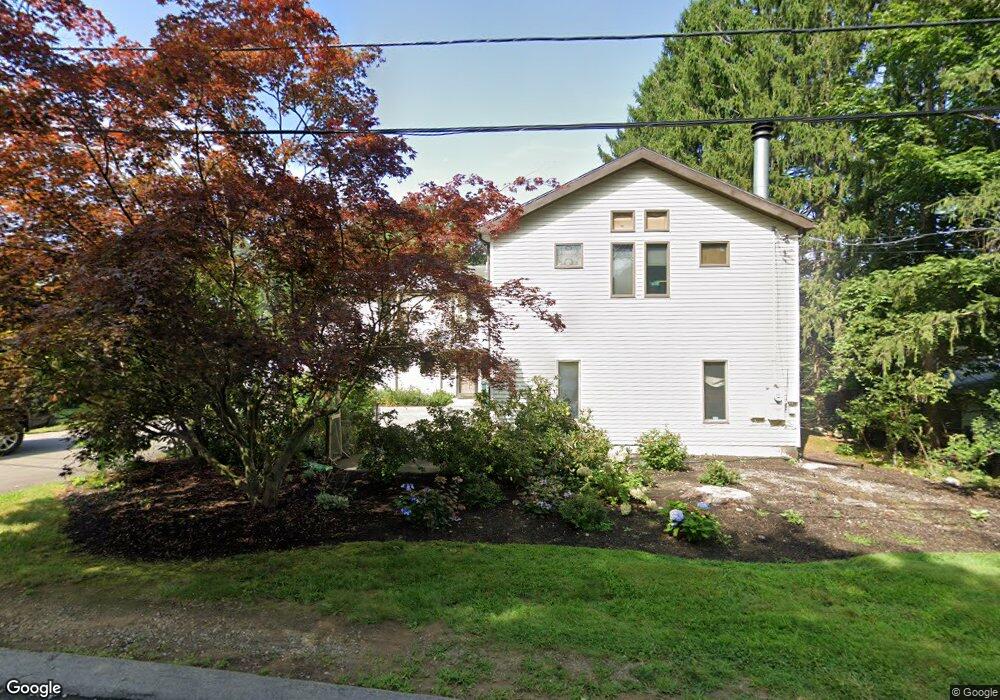
10 Bayfield Rd Wayland, MA 01778
Estimated Value: $1,378,407 - $1,603,000
4
Beds
4
Baths
3,730
Sq Ft
$397/Sq Ft
Est. Value
About This Home
This home is located at 10 Bayfield Rd, Wayland, MA 01778 and is currently estimated at $1,482,352, approximately $397 per square foot. 10 Bayfield Rd is a home located in Middlesex County with nearby schools including Wayland High School and Veritas Christian Academy.
Ownership History
Date
Name
Owned For
Owner Type
Purchase Details
Closed on
Oct 18, 2024
Sold by
Stevens Lois M
Bought by
Stevens Ft and Stevens
Current Estimated Value
Create a Home Valuation Report for This Property
The Home Valuation Report is an in-depth analysis detailing your home's value as well as a comparison with similar homes in the area
Home Values in the Area
Average Home Value in this Area
Purchase History
| Date | Buyer | Sale Price | Title Company |
|---|---|---|---|
| Stevens Ft | -- | None Available | |
| Stevens Ft | -- | None Available | |
| Stevens Ft | -- | None Available |
Source: Public Records
Tax History Compared to Growth
Tax History
| Year | Tax Paid | Tax Assessment Tax Assessment Total Assessment is a certain percentage of the fair market value that is determined by local assessors to be the total taxable value of land and additions on the property. | Land | Improvement |
|---|---|---|---|---|
| 2025 | $18,128 | $1,159,800 | $487,200 | $672,600 |
| 2024 | $17,179 | $1,106,900 | $464,000 | $642,900 |
| 2023 | $16,079 | $965,700 | $421,800 | $543,900 |
| 2022 | $15,724 | $856,900 | $349,300 | $507,600 |
| 2021 | $15,281 | $825,100 | $317,500 | $507,600 |
| 2020 | $14,984 | $843,700 | $317,500 | $526,200 |
| 2019 | $14,225 | $778,200 | $302,400 | $475,800 |
| 2018 | $13,310 | $738,200 | $302,400 | $435,800 |
| 2017 | $12,888 | $710,500 | $287,900 | $422,600 |
| 2016 | $11,937 | $688,400 | $282,300 | $406,100 |
| 2015 | $12,112 | $658,600 | $282,300 | $376,300 |
Source: Public Records
Map
Nearby Homes
- 26 Dudley Rd
- 3 Keith Rd
- 262 Cochituate Rd
- 108 Dudley Rd
- 22 Lakeshore Dr
- 123 Dudley Rd
- 186 Main St Unit 2
- 186 Main St
- 177 Main St
- 233 Lakeshore Dr
- 353 Old Connecticut Path
- 454 Old Connecticut Path
- 136 Commonwealth Rd
- 125 Woodridge Rd
- 35 Snake Brook Rd
- 14 Ferndale Rd
- 3 Ferndale Rd
- 29 Derby St
- 36 Brownlea Rd
- 12 Nancy Rd