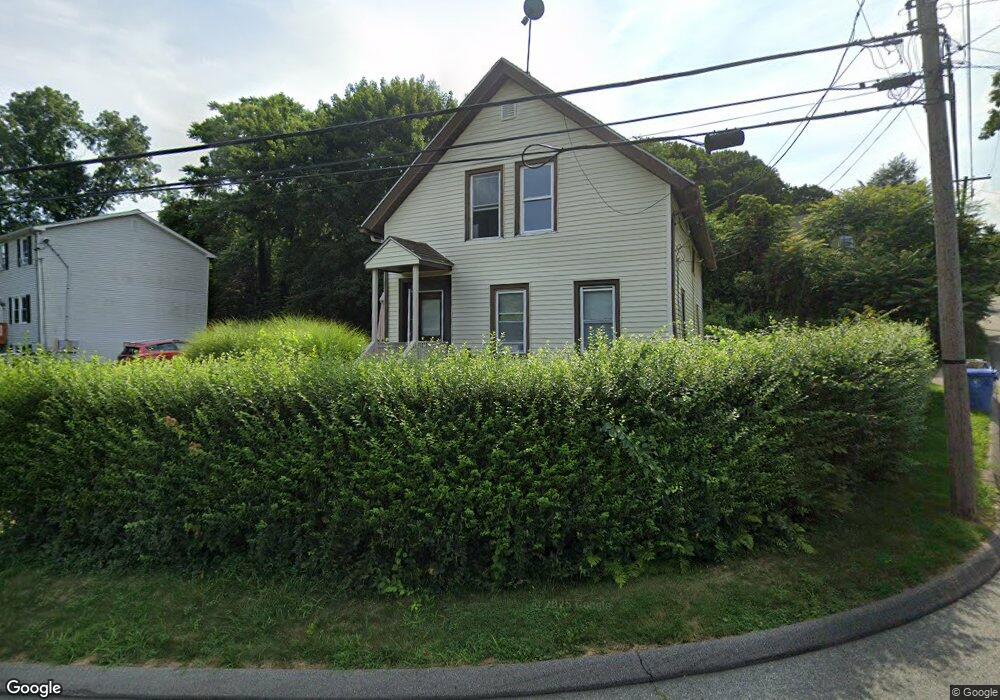
10 Beech St Norwich, CT 06360
Central Norwich NeighborhoodEstimated Value: $246,000 - $271,074
5
Beds
2
Baths
2,131
Sq Ft
$122/Sq Ft
Est. Value
About This Home
This home is located at 10 Beech St, Norwich, CT 06360 and is currently estimated at $259,519, approximately $121 per square foot. 10 Beech St is a home located in New London County with nearby schools including Moriarty Magnet Elementary School, Kelly STEAM Magnet Middle School, and Integrated Day Charter School.
Ownership History
Date
Name
Owned For
Owner Type
Purchase Details
Closed on
Mar 28, 2025
Sold by
Barclay Christopher R
Bought by
Dio Christina and Burgess Magnus
Current Estimated Value
Home Financials for this Owner
Home Financials are based on the most recent Mortgage that was taken out on this home.
Original Mortgage
$245,471
Outstanding Balance
$244,001
Interest Rate
6.87%
Mortgage Type
FHA
Estimated Equity
$15,518
Purchase Details
Closed on
May 5, 2006
Sold by
Rodriguez Alexander
Bought by
Barclay Christopher and Barclay Judy
Home Financials for this Owner
Home Financials are based on the most recent Mortgage that was taken out on this home.
Original Mortgage
$211,500
Interest Rate
6.34%
Purchase Details
Closed on
Apr 9, 1999
Sold by
Mcdonald Bruce T and Mcdonald Gail B
Bought by
Rivera Joselito and Rodriquez Alexandra
Purchase Details
Closed on
Jun 27, 1988
Sold by
Plante Edward N
Bought by
Macdonald Bruce T
Create a Home Valuation Report for This Property
The Home Valuation Report is an in-depth analysis detailing your home's value as well as a comparison with similar homes in the area
Home Values in the Area
Average Home Value in this Area
Purchase History
| Date | Buyer | Sale Price | Title Company |
|---|---|---|---|
| Dio Christina | $250,000 | None Available | |
| Dio Christina | $250,000 | None Available | |
| Barclay Christopher | $235,000 | -- | |
| Barclay Christopher | $235,000 | -- | |
| Rivera Joselito | $79,900 | -- | |
| Rivera Joselito | $79,900 | -- | |
| Macdonald Bruce T | $106,000 | -- |
Source: Public Records
Mortgage History
| Date | Status | Borrower | Loan Amount |
|---|---|---|---|
| Open | Dio Christina | $245,471 | |
| Closed | Dio Christina | $245,471 | |
| Previous Owner | Macdonald Bruce T | $211,500 |
Source: Public Records
Tax History Compared to Growth
Tax History
| Year | Tax Paid | Tax Assessment Tax Assessment Total Assessment is a certain percentage of the fair market value that is determined by local assessors to be the total taxable value of land and additions on the property. | Land | Improvement |
|---|---|---|---|---|
| 2025 | $5,128 | $126,700 | $30,000 | $96,700 |
| 2024 | $4,840 | $126,700 | $30,000 | $96,700 |
| 2023 | $3,979 | $81,800 | $21,200 | $60,600 |
| 2022 | $3,966 | $81,800 | $21,200 | $60,600 |
| 2021 | $3,979 | $81,800 | $21,200 | $60,600 |
| 2020 | $3,965 | $81,800 | $21,200 | $60,600 |
| 2019 | $3,926 | $81,800 | $21,200 | $60,600 |
| 2018 | $3,673 | $75,900 | $25,000 | $50,900 |
| 2017 | $3,699 | $75,900 | $25,000 | $50,900 |
| 2016 | $3,724 | $75,900 | $25,000 | $50,900 |
| 2015 | $3,648 | $75,900 | $25,000 | $50,900 |
| 2014 | $3,486 | $75,900 | $25,000 | $50,900 |
Source: Public Records
Map
Nearby Homes