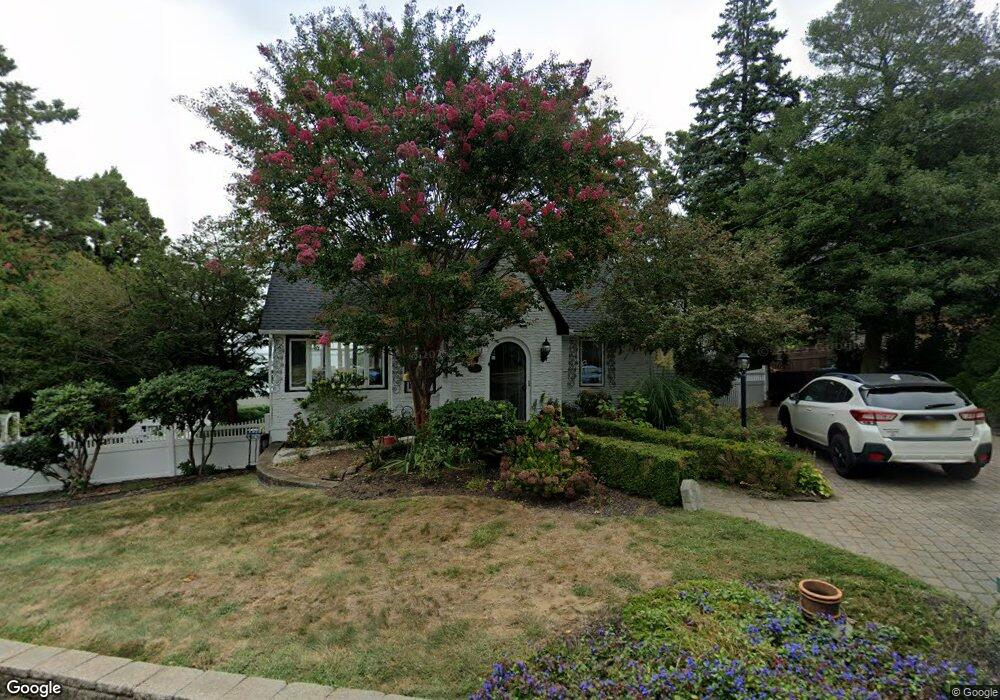
10 Belvidere Rd Atlantic Highlands, NJ 07716
Estimated Value: $785,000 - $1,660,000
1
Bed
2
Baths
936
Sq Ft
$1,200/Sq Ft
Est. Value
About This Home
This home is located at 10 Belvidere Rd, Atlantic Highlands, NJ 07716 and is currently estimated at $1,123,370, approximately $1,200 per square foot. 10 Belvidere Rd is a home located in Monmouth County with nearby schools including Atlantic Highlands Elementary School, Henry Hudson Regional School, and Mountain Hill School.
Ownership History
Date
Name
Owned For
Owner Type
Purchase Details
Closed on
May 18, 2009
Sold by
Hennrich William L and Maureen Hennrich I
Bought by
Mackin Stephen and Mackin Olga
Current Estimated Value
Home Financials for this Owner
Home Financials are based on the most recent Mortgage that was taken out on this home.
Original Mortgage
$350,000
Outstanding Balance
$221,376
Interest Rate
4.87%
Mortgage Type
Stand Alone First
Estimated Equity
$901,994
Purchase Details
Closed on
Jul 20, 1999
Sold by
Baumberger Herman
Bought by
Hennrich William and Hennrich Maureen
Home Financials for this Owner
Home Financials are based on the most recent Mortgage that was taken out on this home.
Original Mortgage
$391,200
Interest Rate
7.81%
Create a Home Valuation Report for This Property
The Home Valuation Report is an in-depth analysis detailing your home's value as well as a comparison with similar homes in the area
Home Values in the Area
Average Home Value in this Area
Purchase History
| Date | Buyer | Sale Price | Title Company |
|---|---|---|---|
| Mackin Stephen | $745,000 | Vested Title Inc | |
| Hennrich William | $489,000 | -- |
Source: Public Records
Mortgage History
| Date | Status | Borrower | Loan Amount |
|---|---|---|---|
| Open | Mackin Stephen | $350,000 | |
| Previous Owner | Hennrich William | $391,200 |
Source: Public Records
Tax History Compared to Growth
Tax History
| Year | Tax Paid | Tax Assessment Tax Assessment Total Assessment is a certain percentage of the fair market value that is determined by local assessors to be the total taxable value of land and additions on the property. | Land | Improvement |
|---|---|---|---|---|
| 2025 | $13,665 | $1,021,400 | $780,000 | $241,400 |
| 2024 | $13,676 | $820,700 | $607,500 | $213,200 |
| 2023 | $13,676 | $800,700 | $592,500 | $208,200 |
| 2022 | $14,883 | $760,800 | $562,500 | $198,300 |
| 2021 | $14,883 | $757,400 | $585,000 | $172,400 |
| 2020 | $15,057 | $757,400 | $585,000 | $172,400 |
| 2019 | $14,984 | $756,400 | $585,000 | $171,400 |
| 2018 | $14,382 | $733,400 | $570,000 | $163,400 |
| 2017 | $16,772 | $631,000 | $435,500 | $195,500 |
| 2016 | $16,539 | $631,000 | $435,500 | $195,500 |
| 2015 | $16,109 | $631,000 | $435,500 | $195,500 |
| 2014 | $14,118 | $560,000 | $400,000 | $160,000 |
Source: Public Records
Map
Nearby Homes
- 18 Belvidere Rd
- 258 Ocean Blvd
- 1 Cameron Cir
- 193 Ocean Blvd
- 4 Isabella Ct
- 4 Hillside Rd
- 49 Pape Dr
- 608 Raritan Ave
- 24 Lighthouse Point Rd
- 1 Scenic Dr Unit Penthouse 6
- 1 Scenic Dr Unit 306
- 1 Scenic Dr Unit 511
- 1 Scenic Dr Unit Penthouse 4
- 1 Scenic Dr Unit 303
- 10 Halfmoon Ct Unit 1103
- 90 E Lincoln Ave
- 38 East Ave
- 61 E Washington Ave
- 51 Matthew St
- 4 Oneida Ave
- 15 Belvidere Rd
- 9 Belvidere Rd
- 15A Belvidere Rd
- 8 Belvidere Rd
- 6 Belvidere Rd
- 14 Belvidere Rd
- 284 Ocean Blvd
- 17 Belvidere Rd
- 1 Belvidere Rd
- 20 Belvidere Rd
- 26 Prospect Rd
- 262 Ocean Blvd
- 275 Ocean Blvd
- 277 Ocean Blvd
- 288 Ocean Blvd
- 279 Ocean Blvd
- 24 Belvidere Rd
- 27 Bayside Dr
- 280 Ocean Blvd
- 17 Bayside Dr