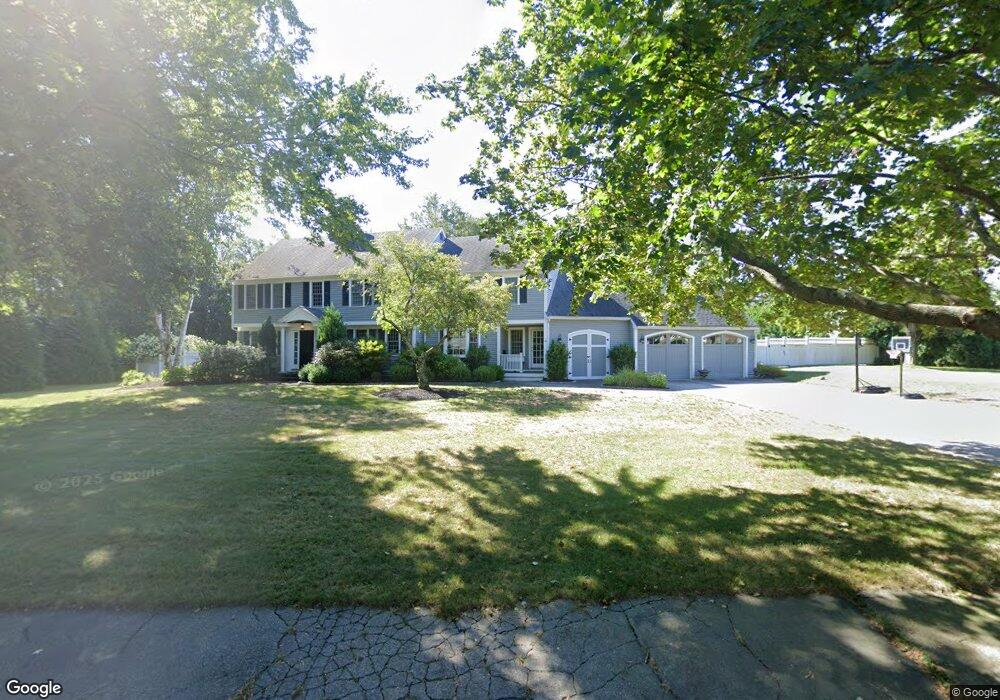
10 Berkley Cir Hingham, MA 02043
Estimated Value: $1,460,000 - $2,206,403
5
Beds
4
Baths
4,018
Sq Ft
$488/Sq Ft
Est. Value
About This Home
This home is located at 10 Berkley Cir, Hingham, MA 02043 and is currently estimated at $1,960,601, approximately $487 per square foot. 10 Berkley Cir is a home located in Plymouth County with nearby schools including Plymouth River Elementary School, South Shore Conservatory of Music Preschool, and St. Paul Elementary School.
Ownership History
Date
Name
Owned For
Owner Type
Purchase Details
Closed on
Nov 23, 2021
Sold by
Joyce Jane K
Bought by
Robertson Kevin and Robertson Amanda
Current Estimated Value
Purchase Details
Closed on
Mar 12, 2004
Sold by
Joyce Michael J and Joyce Jane
Bought by
Joyce Jane K
Home Financials for this Owner
Home Financials are based on the most recent Mortgage that was taken out on this home.
Original Mortgage
$300,000
Interest Rate
5.67%
Mortgage Type
Purchase Money Mortgage
Purchase Details
Closed on
Sep 9, 1993
Sold by
Oleary Brian D and Oleary Susan W
Bought by
Coleman Patrick M and Coleman Joanne H
Create a Home Valuation Report for This Property
The Home Valuation Report is an in-depth analysis detailing your home's value as well as a comparison with similar homes in the area
Home Values in the Area
Average Home Value in this Area
Purchase History
| Date | Buyer | Sale Price | Title Company |
|---|---|---|---|
| Robertson Kevin | $2,000,000 | None Available | |
| Joyce Jane K | -- | -- | |
| Joyce Jane K | -- | -- | |
| Coleman Patrick M | $377,500 | -- |
Source: Public Records
Mortgage History
| Date | Status | Borrower | Loan Amount |
|---|---|---|---|
| Previous Owner | Coleman Patrick M | $300,000 | |
| Previous Owner | Coleman Patrick M | $300,000 |
Source: Public Records
Tax History Compared to Growth
Tax History
| Year | Tax Paid | Tax Assessment Tax Assessment Total Assessment is a certain percentage of the fair market value that is determined by local assessors to be the total taxable value of land and additions on the property. | Land | Improvement |
|---|---|---|---|---|
| 2025 | $19,762 | $1,848,600 | $627,300 | $1,221,300 |
| 2024 | $19,214 | $1,770,900 | $627,300 | $1,143,600 |
| 2023 | $16,683 | $1,668,300 | $627,300 | $1,041,000 |
| 2022 | $16,309 | $1,410,800 | $566,100 | $844,700 |
| 2021 | $13,037 | $1,291,400 | $544,300 | $747,100 |
| 2020 | $14,890 | $1,291,400 | $544,300 | $747,100 |
| 2019 | $12,918 | $1,244,900 | $544,300 | $700,600 |
| 2018 | $14,652 | $1,244,900 | $544,300 | $700,600 |
| 2017 | $14,146 | $1,154,800 | $544,300 | $610,500 |
| 2016 | $14,099 | $1,128,800 | $518,300 | $610,500 |
| 2015 | $13,828 | $1,103,600 | $493,100 | $610,500 |
Source: Public Records
Map
Nearby Homes
- 249 High St
- 2 Black Rock Dr Unit 21
- 2 Black Rock Dr
- 9 Cranberry Ln
- 3 Howland Ln
- 10 Duck Ln
- 124 Charles Diersch St
- 212 Cushing St
- 38 School St Unit 2
- 17 Grove St
- 1297 Pleasant St
- 86 Black Rock Dr
- 639 Main St
- 15 Pioneer Rd
- 3 Patriots Way
- 7 Stevens Way
- 171 Fort Hill St
- 36 Smith Rd
- 38 Smith Rd
- 12 Merrymount Rd