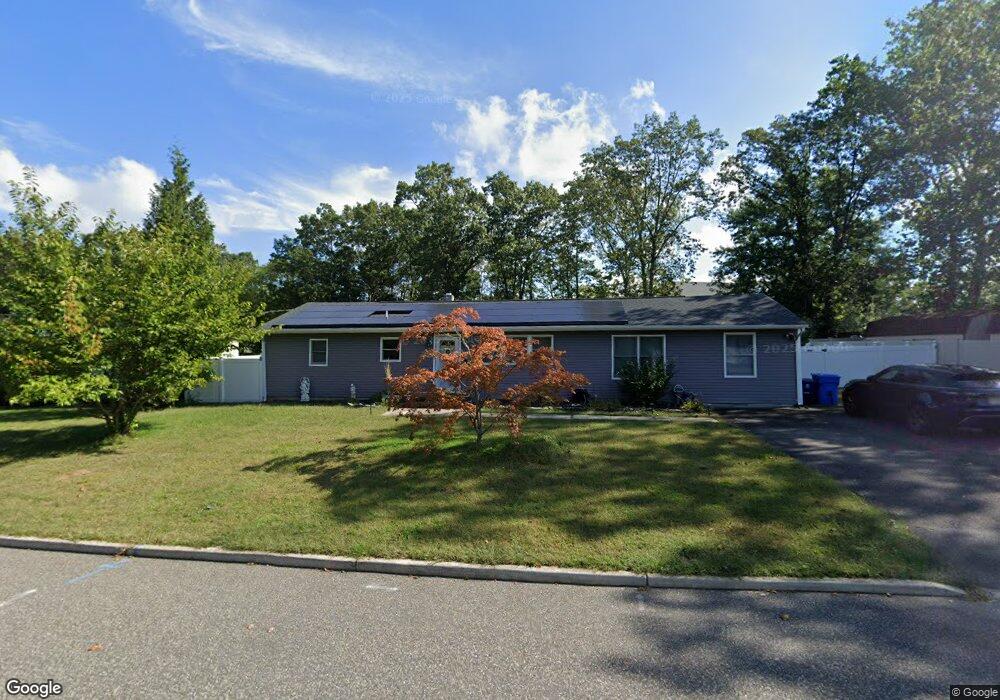
10 Blake Dr Howell, NJ 07731
Ramtown NeighborhoodEstimated Value: $493,000 - $543,000
3
Beds
1
Bath
1,428
Sq Ft
$371/Sq Ft
Est. Value
About This Home
This home is located at 10 Blake Dr, Howell, NJ 07731 and is currently estimated at $530,200, approximately $371 per square foot. 10 Blake Dr is a home located in Monmouth County with nearby schools including Ramtown School, Greenville School, and Howell Township Middle School South.
Ownership History
Date
Name
Owned For
Owner Type
Purchase Details
Closed on
Aug 6, 2007
Sold by
Luicci Bonnie S and Muolo Bonnie S
Bought by
Muolo Anthony and Muolo Bonnie S
Current Estimated Value
Home Financials for this Owner
Home Financials are based on the most recent Mortgage that was taken out on this home.
Original Mortgage
$287,500
Outstanding Balance
$131,677
Interest Rate
6.78%
Mortgage Type
New Conventional
Estimated Equity
$398,523
Purchase Details
Closed on
Jun 6, 2005
Sold by
Killion Raymond E
Bought by
Luicci Bonnie S
Home Financials for this Owner
Home Financials are based on the most recent Mortgage that was taken out on this home.
Original Mortgage
$224,000
Interest Rate
7.73%
Mortgage Type
Adjustable Rate Mortgage/ARM
Purchase Details
Closed on
Dec 9, 1997
Sold by
Federal Home Loan
Bought by
Killion Raymond and Killion Theresa
Home Financials for this Owner
Home Financials are based on the most recent Mortgage that was taken out on this home.
Original Mortgage
$60,000
Interest Rate
7.08%
Create a Home Valuation Report for This Property
The Home Valuation Report is an in-depth analysis detailing your home's value as well as a comparison with similar homes in the area
Home Values in the Area
Average Home Value in this Area
Purchase History
| Date | Buyer | Sale Price | Title Company |
|---|---|---|---|
| Muolo Anthony | -- | First American Title Ins Co | |
| Luicci Bonnie S | $280,000 | -- | |
| Killion Raymond | $88,000 | -- |
Source: Public Records
Mortgage History
| Date | Status | Borrower | Loan Amount |
|---|---|---|---|
| Open | Muolo Anthony | $287,500 | |
| Previous Owner | Luicci Bonnie S | $224,000 | |
| Previous Owner | Killion Raymond | $60,000 |
Source: Public Records
Tax History Compared to Growth
Tax History
| Year | Tax Paid | Tax Assessment Tax Assessment Total Assessment is a certain percentage of the fair market value that is determined by local assessors to be the total taxable value of land and additions on the property. | Land | Improvement |
|---|---|---|---|---|
| 2025 | $7,941 | $496,300 | $338,400 | $157,900 |
| 2024 | $7,711 | $448,400 | $293,400 | $155,000 |
| 2023 | $7,711 | $414,800 | $263,400 | $151,400 |
| 2022 | $6,109 | $310,500 | $188,400 | $122,100 |
| 2021 | $6,109 | $267,000 | $158,400 | $108,600 |
| 2020 | $6,151 | $265,800 | $158,400 | $107,400 |
| 2019 | $6,225 | $264,000 | $158,400 | $105,600 |
| 2018 | $6,141 | $259,100 | $158,400 | $100,700 |
| 2017 | $5,657 | $236,000 | $138,400 | $97,600 |
| 2016 | $5,184 | $213,500 | $118,400 | $95,100 |
| 2015 | $4,935 | $201,100 | $108,400 | $92,700 |
| 2014 | $5,711 | $216,000 | $135,100 | $80,900 |
Source: Public Records
Map
Nearby Homes