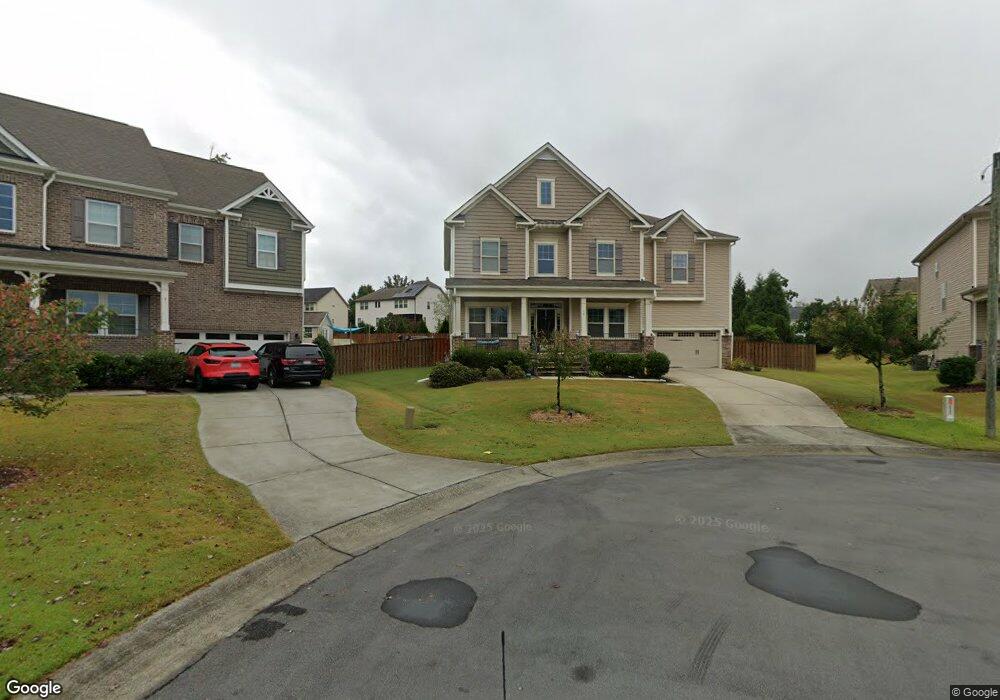
10 Bonsack Durham, NC 27703
Eastern Durham NeighborhoodEstimated Value: $709,000 - $794,196
5
Beds
4
Baths
3,539
Sq Ft
$210/Sq Ft
Est. Value
About This Home
This home is located at 10 Bonsack, Durham, NC 27703 and is currently estimated at $743,799, approximately $210 per square foot. 10 Bonsack is a home located in Durham County with nearby schools including Spring Valley Elementary School, John W Neal Middle School, and Southern School of Energy & Sustainability.
Ownership History
Date
Name
Owned For
Owner Type
Purchase Details
Closed on
Apr 12, 2017
Sold by
Calatlantic Grp Inc
Bought by
Richardson Marilyn E and Richardson Linda C
Current Estimated Value
Home Financials for this Owner
Home Financials are based on the most recent Mortgage that was taken out on this home.
Original Mortgage
$190,000
Outstanding Balance
$158,496
Interest Rate
4.3%
Mortgage Type
New Conventional
Estimated Equity
$585,303
Purchase Details
Closed on
Jun 30, 2016
Sold by
Mrec Brightleaf Llc
Bought by
Calatlantic Grp Inc
Create a Home Valuation Report for This Property
The Home Valuation Report is an in-depth analysis detailing your home's value as well as a comparison with similar homes in the area
Home Values in the Area
Average Home Value in this Area
Purchase History
| Date | Buyer | Sale Price | Title Company |
|---|---|---|---|
| Richardson Marilyn E | $407,000 | -- | |
| Calatlantic Grp Inc | $2,075,000 | -- |
Source: Public Records
Mortgage History
| Date | Status | Borrower | Loan Amount |
|---|---|---|---|
| Open | Richardson Marilyn E | $190,000 |
Source: Public Records
Tax History
| Year | Tax Paid | Tax Assessment Tax Assessment Total Assessment is a certain percentage of the fair market value that is determined by local assessors to be the total taxable value of land and additions on the property. | Land | Improvement |
|---|---|---|---|---|
| 2025 | $8,553 | $862,824 | $129,500 | $733,324 |
| 2024 | $6,450 | $462,370 | $71,683 | $390,687 |
| 2023 | $6,057 | $462,370 | $71,683 | $390,687 |
| 2022 | $5,918 | $462,370 | $71,683 | $390,687 |
| 2021 | $5,536 | $434,600 | $71,683 | $362,917 |
| 2020 | $5,406 | $434,600 | $71,683 | $362,917 |
| 2019 | $5,406 | $434,600 | $71,683 | $362,917 |
| 2018 | $5,614 | $413,828 | $73,900 | $339,928 |
| 2017 | $995 | $73,900 | $73,900 | $0 |
| 2016 | $962 | $73,900 | $73,900 | $0 |
| 2015 | $1,441 | $104,072 | $104,072 | $0 |
| 2014 | $1,441 | $104,072 | $104,072 | $0 |
Source: Public Records
Map
Nearby Homes
- 1020 Constellation Cir
- 1821 S Mineral Springs Rd
- 1602 Eagle Lodge Ln
- 3105 Ranger Dr
- 1611 Eagle Lodge Ln
- 1607 Eagle Lodge Ln
- 3112 Ranger Dr
- 500 Kings Lake Way
- 1948 Hinesley Dr
- 1950 Hinesley Dr
- 1944 Hinesley Dr
- 1942 Hinesley Dr
- 1936 Hinesley Dr
- 1940 Hinesley Dr
- 1938 Hinesley Dr
- 1932 Hinesley Dr
- 1934 Hinesley Dr
- 533 Kings Lake Way
- 106 Token House Rd
- 1946 Hinesley Dr
- 9 Bonsack
- 8 Bonsack Ct
- 2010 Golden Belt Pkwy
- 2008 Golden Belt Pkwy
- 2006 Golden Belt Pkwy
- 7 Bonsack Ct
- 2012 Golden Belt Pkwy
- 6 Bonsack
- 1905 Pattersons Mill Rd
- 1903 Pattersons Mill Rd
- 2004 Golden Belt Pkwy
- 5 Bonsack Ct
- 1807 Pattersons Mill Rd
- 1907 Pattersons Mill Rd
- 2014 Golden Belt Pkwy
- 3 Bonsack Ct
- 1909 Pattersons Mill Rd
- 4 Bonsack Ct
- 2002 Golden Belt Pkwy
- 2009 Golden Belt Pkwy
Your Personal Tour Guide
Ask me questions while you tour the home.