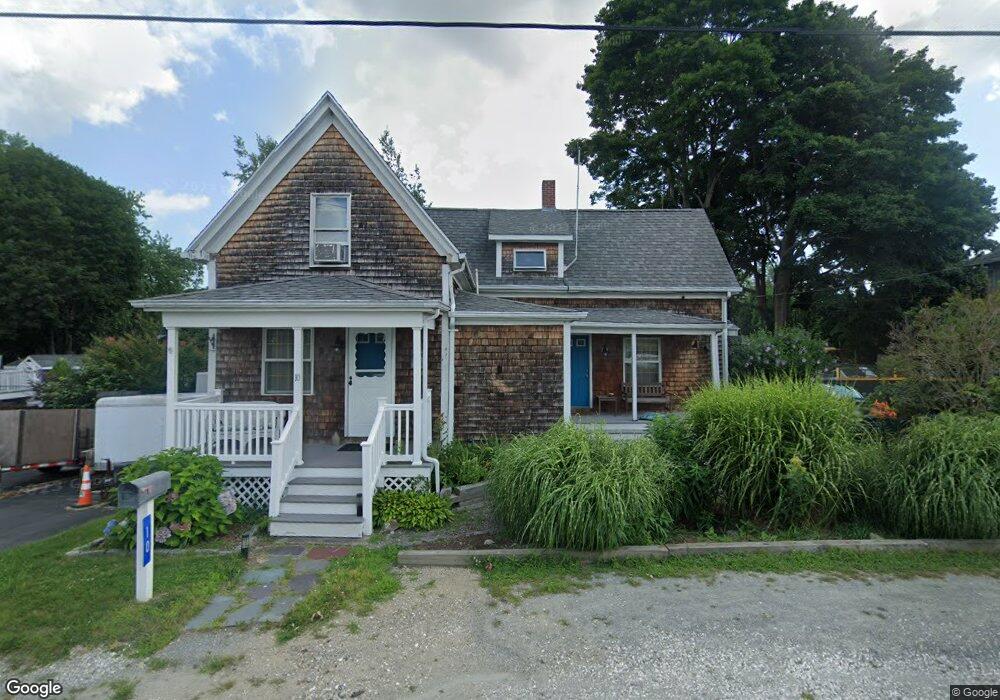
10 Boylston St Acushnet, MA 02743
Upper Acushnet NeighborhoodEstimated Value: $395,000 - $551,000
4
Beds
2
Baths
1,362
Sq Ft
$324/Sq Ft
Est. Value
About This Home
This home is located at 10 Boylston St, Acushnet, MA 02743 and is currently estimated at $441,808, approximately $324 per square foot. 10 Boylston St is a home located in Bristol County with nearby schools including Acushnet Elementary School, Albert F Ford Middle School, and Alma Del Mar Charter School.
Ownership History
Date
Name
Owned For
Owner Type
Purchase Details
Closed on
Apr 27, 1990
Sold by
Est Anuszdzyk Wanda K
Bought by
Chace Merrill E
Current Estimated Value
Home Financials for this Owner
Home Financials are based on the most recent Mortgage that was taken out on this home.
Original Mortgage
$93,150
Interest Rate
10.26%
Mortgage Type
Purchase Money Mortgage
Create a Home Valuation Report for This Property
The Home Valuation Report is an in-depth analysis detailing your home's value as well as a comparison with similar homes in the area
Home Values in the Area
Average Home Value in this Area
Purchase History
| Date | Buyer | Sale Price | Title Company |
|---|---|---|---|
| Chace Merrill E | $92,000 | -- |
Source: Public Records
Mortgage History
| Date | Status | Borrower | Loan Amount |
|---|---|---|---|
| Open | Chace Merrill E | $103,000 | |
| Closed | Chace Merrill E | $3,500 | |
| Closed | Chace Merrill E | $95,585 | |
| Closed | Chace Merrill E | $93,150 |
Source: Public Records
Tax History
| Year | Tax Paid | Tax Assessment Tax Assessment Total Assessment is a certain percentage of the fair market value that is determined by local assessors to be the total taxable value of land and additions on the property. | Land | Improvement |
|---|---|---|---|---|
| 2025 | $34 | $310,800 | $89,300 | $221,500 |
| 2024 | $3,374 | $295,700 | $85,100 | $210,600 |
| 2023 | $3,170 | $264,200 | $76,800 | $187,400 |
| 2022 | $3,243 | $244,400 | $72,700 | $171,700 |
| 2021 | $2,947 | $213,100 | $72,700 | $140,400 |
| 2020 | $2,971 | $213,100 | $72,700 | $140,400 |
| 2019 | $2,737 | $193,000 | $64,400 | $128,600 |
| 2018 | $2,652 | $183,900 | $64,400 | $119,500 |
| 2017 | $2,550 | $176,600 | $64,400 | $112,200 |
| 2016 | $2,415 | $166,200 | $64,400 | $101,800 |
| 2015 | $2,373 | $166,200 | $64,400 | $101,800 |
Source: Public Records
Map
Nearby Homes
Your Personal Tour Guide
Ask me questions while you tour the home.