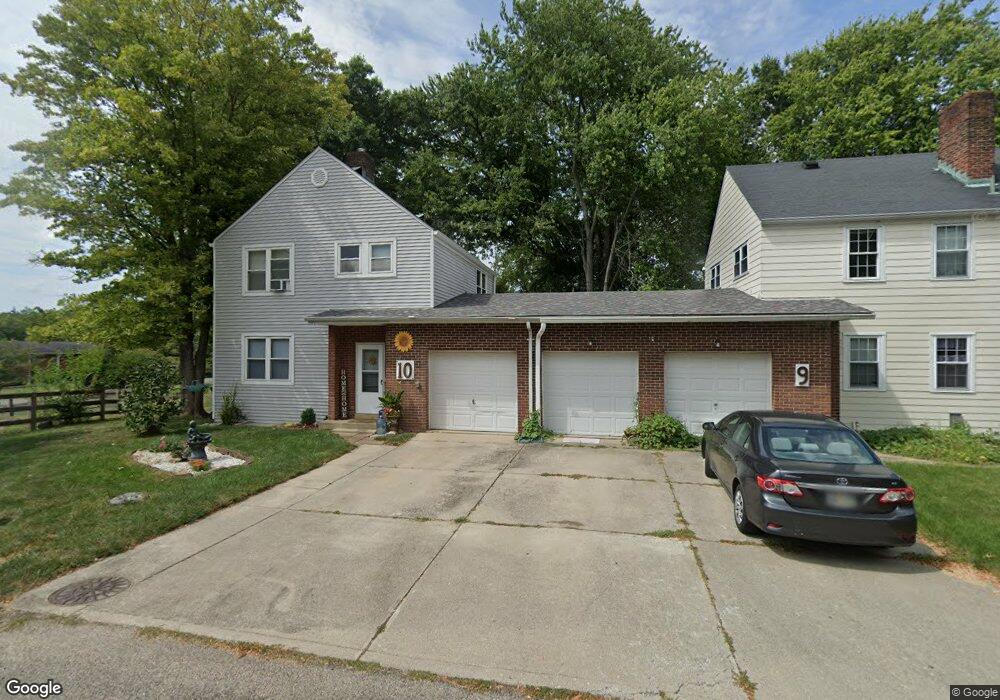
10 Bradnor Place Cincinnati, OH 45218
Estimated Value: $120,000 - $181,892
3
Beds
2
Baths
1,248
Sq Ft
$128/Sq Ft
Est. Value
About This Home
This home is located at 10 Bradnor Place, Cincinnati, OH 45218 and is currently estimated at $159,973, approximately $128 per square foot. 10 Bradnor Place is a home located in Hamilton County with nearby schools including Central Montessori Academy and John Paul II Catholic School.
Ownership History
Date
Name
Owned For
Owner Type
Purchase Details
Closed on
Aug 27, 2018
Sold by
Limbocker Christina and Kolde Christina
Bought by
Limbocker Petra
Current Estimated Value
Purchase Details
Closed on
Dec 5, 2011
Sold by
Carter Christine
Bought by
Limbocker Christina
Purchase Details
Closed on
Apr 20, 2006
Sold by
Murray Andrew J and Murray Angela R
Bought by
Carter Christine
Home Financials for this Owner
Home Financials are based on the most recent Mortgage that was taken out on this home.
Original Mortgage
$92,800
Interest Rate
6.54%
Mortgage Type
Fannie Mae Freddie Mac
Purchase Details
Closed on
Apr 1, 1997
Sold by
Chiasson William R and Chiasson Janet M
Bought by
Murray Andrew J and Murray Angela R
Home Financials for this Owner
Home Financials are based on the most recent Mortgage that was taken out on this home.
Original Mortgage
$49,500
Interest Rate
7.65%
Purchase Details
Closed on
Dec 13, 1994
Sold by
Chiasson Doug and Chiasson Valerie
Bought by
Chiasson William R and Chiasson Janet M
Create a Home Valuation Report for This Property
The Home Valuation Report is an in-depth analysis detailing your home's value as well as a comparison with similar homes in the area
Home Values in the Area
Average Home Value in this Area
Purchase History
We collect this data history from publicly available records. To have your information removed, we recommend requesting removal directly through your county’s website.
| Date | Buyer | Sale Price | Title Company |
|---|---|---|---|
| Limbocker Petra | -- | None Available | |
| Limbocker Christina | $50,000 | Attorney | |
| Carter Christine | $116,000 | Premier Title Services Inc | |
| Murray Andrew J | $65,000 | -- | |
| Chiasson William R | -- | -- |
Source: Public Records
Mortgage History
We collect this data history from publicly available records. To have your information removed, we recommend requesting removal directly through your county’s website.
| Date | Status | Borrower | Loan Amount |
|---|---|---|---|
| Previous Owner | Carter Christine | $92,800 | |
| Previous Owner | Murray Andrew J | $49,500 | |
| Closed | Murray Andrew J | $49,500 |
Source: Public Records
Tax History
| Year | Tax Paid | Tax Assessment Tax Assessment Total Assessment is a certain percentage of the fair market value that is determined by local assessors to be the total taxable value of land and additions on the property. | Land | Improvement |
|---|---|---|---|---|
| 2025 | $2,423 | $43,698 | $10,255 | $33,443 |
| 2023 | $2,140 | $43,698 | $10,255 | $33,443 |
| 2022 | $1,630 | $28,365 | $8,558 | $19,807 |
| 2021 | $2,312 | $28,365 | $8,558 | $19,807 |
| 2020 | $2,346 | $28,365 | $8,558 | $19,807 |
| 2019 | $2,281 | $24,245 | $7,315 | $16,930 |
| 2018 | $2,285 | $24,245 | $7,315 | $16,930 |
| 2017 | $2,118 | $24,245 | $7,315 | $16,930 |
| 2016 | $1,569 | $17,500 | $8,400 | $9,100 |
| 2015 | $1,475 | $17,500 | $8,400 | $9,100 |
| 2014 | $1,509 | $17,500 | $8,400 | $9,100 |
| 2013 | $1,468 | $17,500 | $8,400 | $9,100 |
Source: Public Records
Map
Nearby Homes
- 8 Bradnor Place
- 6 Bradnor Place
- 9 Bradnor Place
- 7 Bradnor Place
- 3 Beckford Dr
- 5 Bradnor Place
- 11 Bradnor Place
- 117 Bayham Dr
- 121 Bayham Dr
- 113 Bayham Dr
- 4 Bradnor Place
- 12 Bradnor Place
- 109 Bayham Dr
- 3 Bradnor Place
- 125 Bayham Dr
- 2 Bradnor Place
- 105 Bayham Dr
- 1 Bradnor Place
- 45 Burley Cir
- 1 Beckford Dr
Your Personal Tour Guide
Ask me questions while you tour the home.