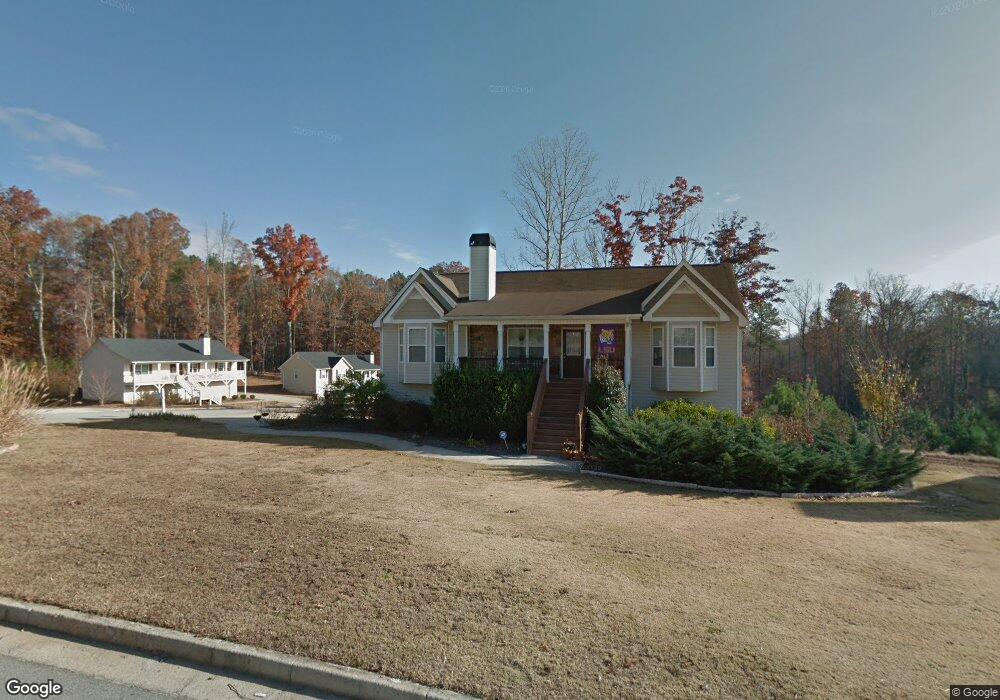
10 Brookcliff Ct Unit 12 Temple, GA 30179
Estimated Value: $271,831 - $291,000
3
Beds
2
Baths
1,320
Sq Ft
$216/Sq Ft
Est. Value
About This Home
This home is located at 10 Brookcliff Ct Unit 12, Temple, GA 30179 and is currently estimated at $284,958, approximately $215 per square foot. 10 Brookcliff Ct Unit 12 is a home located in Paulding County with nearby schools including Union Elementary School, Carl Scoggins Sr. Middle School, and South Paulding High School.
Ownership History
Date
Name
Owned For
Owner Type
Purchase Details
Closed on
Jul 5, 2017
Sold by
Ingram Michael
Bought by
Rcm Fund 1 Owner Llc
Current Estimated Value
Purchase Details
Closed on
May 27, 2015
Sold by
Ingram Michael
Bought by
Ingram Michael and Ingram Tammy L
Home Financials for this Owner
Home Financials are based on the most recent Mortgage that was taken out on this home.
Original Mortgage
$112,917
Interest Rate
4.5%
Mortgage Type
FHA
Purchase Details
Closed on
Apr 23, 2012
Sold by
Downing Jolena
Bought by
Downing Jolena
Home Financials for this Owner
Home Financials are based on the most recent Mortgage that was taken out on this home.
Original Mortgage
$114,483
Interest Rate
4.25%
Mortgage Type
FHA
Purchase Details
Closed on
Jan 20, 2005
Sold by
Rock Solid Builders
Purchase Details
Closed on
Sep 1, 2004
Sold by
J & D Development A Ga Gen Par
Purchase Details
Closed on
Mar 18, 2004
Sold by
Honeysuckle Partners Llc
Create a Home Valuation Report for This Property
The Home Valuation Report is an in-depth analysis detailing your home's value as well as a comparison with similar homes in the area
Home Values in the Area
Average Home Value in this Area
Purchase History
| Date | Buyer | Sale Price | Title Company |
|---|---|---|---|
| Rcm Fund 1 Owner Llc | $110,000 | -- | |
| Ingram Michael | -- | -- | |
| Ingram Michael | $115,000 | -- | |
| Downing Jolena | -- | -- | |
| Rice Downing Jolena | -- | -- | |
| -- | $128,300 | -- | |
| -- | -- | -- | |
| -- | -- | -- |
Source: Public Records
Mortgage History
| Date | Status | Borrower | Loan Amount |
|---|---|---|---|
| Previous Owner | Ingram Michael | $112,917 | |
| Previous Owner | Rice Downing Jolena | $114,483 |
Source: Public Records
Tax History
| Year | Tax Paid | Tax Assessment Tax Assessment Total Assessment is a certain percentage of the fair market value that is determined by local assessors to be the total taxable value of land and additions on the property. | Land | Improvement |
|---|---|---|---|---|
| 2025 | $2,783 | $111,872 | $12,000 | $99,872 |
| 2024 | $2,781 | $111,780 | $12,000 | $99,780 |
| 2023 | $2,914 | $111,780 | $12,000 | $99,780 |
| 2022 | $2,326 | $89,220 | $12,000 | $77,220 |
| 2021 | $2,077 | $71,472 | $8,000 | $63,472 |
| 2020 | $2,049 | $68,984 | $8,000 | $60,984 |
| 2019 | $1,989 | $66,004 | $8,000 | $58,004 |
| 2018 | $1,326 | $57,720 | $8,000 | $49,720 |
| 2017 | $1,517 | $51,516 | $8,000 | $43,516 |
| 2016 | $1,335 | $48,760 | $8,000 | $40,760 |
| 2015 | $1,109 | $36,020 | $8,000 | $28,020 |
| 2014 | $915 | $28,972 | $8,000 | $20,972 |
| 2013 | -- | $25,200 | $8,000 | $17,200 |
Source: Public Records
Map
Nearby Homes
- 138 W Fork Way
- 397 Elk Dr
- 211 Ivey Terrace
- 211 Ivey Terrace Unit 29
- 213 Ivey Terrace Unit 30
- 217 Ivey Terrace Unit 32
- 217 Ivey Terrace
- 191 Meadow Spring Ln
- 11070 Buchanan Hwy
- 718 Baskin Rd
- 1968 Allgood Church Rd
- 858 Honeysuckle Ln
- 920 Courthouse Rd
- 250 Carter Creek Dr
- 0 Courthouse Park Dr Unit 10491475
- 249 Wilson Rd
- 125 Tricias Way
- 502 Courthouse Park Dr
- 493 Courthouse Park Dr
- 265 Honeysuckle Ln
- 10 Brookcliff Ct
- 15 Brookcliff Ct
- 163 Meadow Spring Dr
- 167 Meadow Spring Dr
- 17 Fieldstone Ct
- 31 Brookcliff Ct
- 51 Brookcliff Ct
- 75 Brookcliff Ct
- 108 Meadow Spring Dr
- 86 Brookcliff Ct
- 207 Meadow Spring Dr
- 41 Fieldstone Ct
- 87 Meadow Spring Dr
- 200 Meadow Spring Dr
- 44 Fieldstone Ct
- 78 Meadow Spring Dr
- 216 Meadow Spring Dr
- 227 Meadow Spring Dr
- 53 Fieldstone Ct
- 95 Brookcliff Ct
Your Personal Tour Guide
Ask me questions while you tour the home.