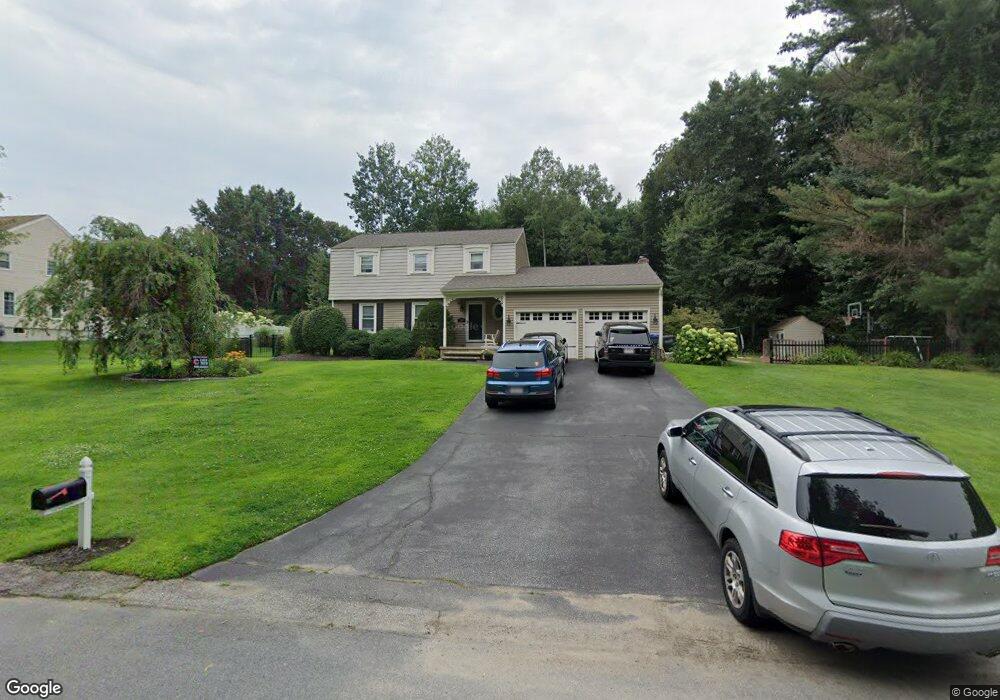
10 Brookside Ct Methuen, MA 01844
The North End NeighborhoodEstimated Value: $732,000 - $828,000
3
Beds
4
Baths
2,593
Sq Ft
$300/Sq Ft
Est. Value
About This Home
This home is located at 10 Brookside Ct, Methuen, MA 01844 and is currently estimated at $777,797, approximately $299 per square foot. 10 Brookside Ct is a home located in Essex County with nearby schools including Methuen High School and The Birches Academy of Academics and Art.
Ownership History
Date
Name
Owned For
Owner Type
Purchase Details
Closed on
Dec 1, 2003
Sold by
Dionne Brenda P and Dionne Wilfred
Bought by
Jankowski Genevre D and Jankowski Timothy M
Current Estimated Value
Home Financials for this Owner
Home Financials are based on the most recent Mortgage that was taken out on this home.
Original Mortgage
$299,900
Outstanding Balance
$141,003
Interest Rate
6.09%
Mortgage Type
Purchase Money Mortgage
Estimated Equity
$636,794
Create a Home Valuation Report for This Property
The Home Valuation Report is an in-depth analysis detailing your home's value as well as a comparison with similar homes in the area
Home Values in the Area
Average Home Value in this Area
Purchase History
| Date | Buyer | Sale Price | Title Company |
|---|---|---|---|
| Jankowski Genevre D | $374,900 | -- | |
| Jankowski Genevre D | $374,900 | -- |
Source: Public Records
Mortgage History
| Date | Status | Borrower | Loan Amount |
|---|---|---|---|
| Open | Jankowski Genevre D | $299,900 | |
| Closed | Jankowski Genevre D | $299,900 | |
| Previous Owner | Jankowski Genevre D | $156,000 |
Source: Public Records
Tax History
| Year | Tax Paid | Tax Assessment Tax Assessment Total Assessment is a certain percentage of the fair market value that is determined by local assessors to be the total taxable value of land and additions on the property. | Land | Improvement |
|---|---|---|---|---|
| 2025 | $7,266 | $686,800 | $305,200 | $381,600 |
| 2024 | $6,972 | $642,000 | $268,100 | $373,900 |
| 2023 | $6,611 | $565,000 | $237,100 | $327,900 |
| 2022 | $6,178 | $473,400 | $206,200 | $267,200 |
| 2021 | $5,995 | $454,500 | $195,900 | $258,600 |
| 2020 | $5,849 | $435,200 | $195,900 | $239,300 |
| 2019 | $5,635 | $397,100 | $185,600 | $211,500 |
| 2018 | $5,307 | $371,900 | $185,600 | $186,300 |
| 2017 | $5,352 | $365,300 | $185,600 | $179,700 |
| 2016 | $5,312 | $358,700 | $185,600 | $173,100 |
| 2015 | $5,141 | $352,100 | $185,600 | $166,500 |
Source: Public Records
Map
Nearby Homes
- 48 Butler St
- 10 Evelyn Rd
- 139 North St
- 8 Cole St
- 20 Williams St
- 9 Clydesdale Rd
- 117 Lawrence Rd
- 4 Mulberry Rd
- 27 Mary Lou St
- 3 Adams Ave
- 159-161 Howe St
- 40 Stanwood Rd Unit 9
- 12 Braemoor Woods Rd Unit 206
- 55 Phoebe St Unit 32
- 59 Cluff Rd Unit 41
- 59 Cluff Rd Unit 62
- 10 Braemoor Woods Rd Unit 300
- 7 Benning St
- 47 Bailey Ct
- 5 Sally Sweets Way Unit 110
Your Personal Tour Guide
Ask me questions while you tour the home.