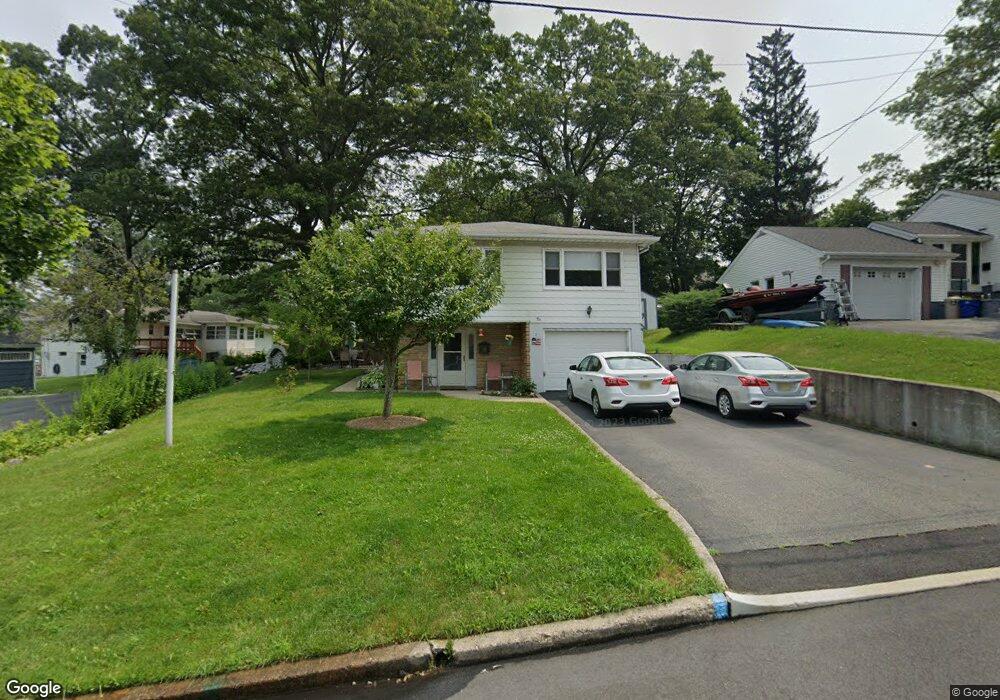
10 Brookside Rd Netcong, NJ 07857
Estimated Value: $459,432 - $548,000
Studio
--
Bath
1,824
Sq Ft
$287/Sq Ft
Est. Value
About This Home
This home is located at 10 Brookside Rd, Netcong, NJ 07857 and is currently estimated at $523,108, approximately $286 per square foot. 10 Brookside Rd is a home located in Morris County with nearby schools including Netcong Elementary School, Lenape Val Regional High School, and St. Therese School.
Ownership History
Date
Name
Owned For
Owner Type
Purchase Details
Closed on
Jul 21, 2017
Sold by
Kronen Donna M and Biasi Cynthia A
Bought by
Biasi Patrick A and Biasi Cynthia A
Current Estimated Value
Home Financials for this Owner
Home Financials are based on the most recent Mortgage that was taken out on this home.
Original Mortgage
$136,000
Outstanding Balance
$70,009
Interest Rate
3.18%
Mortgage Type
New Conventional
Estimated Equity
$453,099
Purchase Details
Closed on
Jun 8, 2017
Sold by
Kronen Donna M and Rea Gladys M
Bought by
Bell Patricia A and Biasi Cynthia A
Home Financials for this Owner
Home Financials are based on the most recent Mortgage that was taken out on this home.
Original Mortgage
$136,000
Outstanding Balance
$70,009
Interest Rate
3.18%
Mortgage Type
New Conventional
Estimated Equity
$453,099
Create a Home Valuation Report for This Property
The Home Valuation Report is an in-depth analysis detailing your home's value as well as a comparison with similar homes in the area
Home Values in the Area
Average Home Value in this Area
Purchase History
| Date | Buyer | Sale Price | Title Company |
|---|---|---|---|
| Biasi Patrick A | $130,000 | Mooris Hoem Tile Agency | |
| Bell Patricia A | -- | -- |
Source: Public Records
Mortgage History
| Date | Status | Borrower | Loan Amount |
|---|---|---|---|
| Open | Biasi Patrick A | $136,000 | |
| Previous Owner | Bell Patricia A | -- |
Source: Public Records
Tax History
| Year | Tax Paid | Tax Assessment Tax Assessment Total Assessment is a certain percentage of the fair market value that is determined by local assessors to be the total taxable value of land and additions on the property. | Land | Improvement |
|---|---|---|---|---|
| 2025 | $9,602 | $281,000 | $125,000 | $156,000 |
| 2024 | $9,686 | $281,000 | $125,000 | $156,000 |
Source: Public Records
Map
Nearby Homes
Your Personal Tour Guide
Ask me questions while you tour the home.