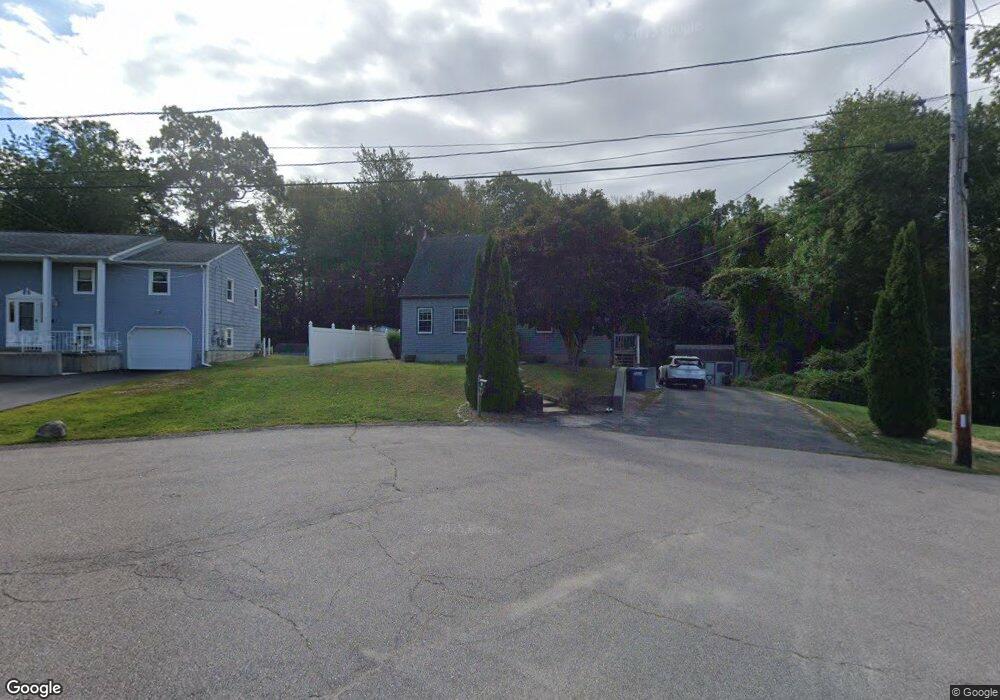
10 Brookview Ct Westerly, RI 02891
Estimated Value: $496,000 - $574,000
3
Beds
3
Baths
1,944
Sq Ft
$269/Sq Ft
Est. Value
About This Home
This home is located at 10 Brookview Ct, Westerly, RI 02891 and is currently estimated at $523,833, approximately $269 per square foot. 10 Brookview Ct is a home located in Washington County with nearby schools including Westerly High School, North Stonington Christian Academy, and St. Michael School.
Ownership History
Date
Name
Owned For
Owner Type
Purchase Details
Closed on
Oct 19, 2021
Sold by
Comforti Joseph P
Bought by
Comforti Joseph P and Comforti Amber C
Current Estimated Value
Home Financials for this Owner
Home Financials are based on the most recent Mortgage that was taken out on this home.
Original Mortgage
$291,000
Outstanding Balance
$242,340
Interest Rate
2.88%
Mortgage Type
New Conventional
Estimated Equity
$281,493
Purchase Details
Closed on
Oct 5, 2016
Sold by
Alicchio Nathony P and Alicchio Lisa A
Bought by
Comforti Joseph P
Home Financials for this Owner
Home Financials are based on the most recent Mortgage that was taken out on this home.
Original Mortgage
$257,050
Interest Rate
3.43%
Mortgage Type
New Conventional
Purchase Details
Closed on
May 31, 1994
Sold by
Leighton Joanne
Bought by
Terranova Michael T
Create a Home Valuation Report for This Property
The Home Valuation Report is an in-depth analysis detailing your home's value as well as a comparison with similar homes in the area
Home Values in the Area
Average Home Value in this Area
Purchase History
| Date | Buyer | Sale Price | Title Company |
|---|---|---|---|
| Comforti Joseph P | -- | None Available | |
| Comforti Joseph P | $265,000 | -- | |
| Terranova Michael T | $119,000 | -- |
Source: Public Records
Mortgage History
| Date | Status | Borrower | Loan Amount |
|---|---|---|---|
| Open | Comforti Joseph P | $291,000 | |
| Previous Owner | Comforti Joseph P | $257,050 | |
| Previous Owner | Terranova Michael T | $271,500 | |
| Previous Owner | Terranova Michael T | $25,000 | |
| Previous Owner | Terranova Michael T | $240,000 |
Source: Public Records
Tax History
| Year | Tax Paid | Tax Assessment Tax Assessment Total Assessment is a certain percentage of the fair market value that is determined by local assessors to be the total taxable value of land and additions on the property. | Land | Improvement |
|---|---|---|---|---|
| 2025 | $3,175 | $408,100 | $172,800 | $235,300 |
| 2024 | $3,387 | $324,100 | $123,600 | $200,500 |
| 2023 | $3,293 | $324,100 | $123,600 | $200,500 |
| 2022 | $3,273 | $324,100 | $123,600 | $200,500 |
| 2021 | $3,156 | $261,700 | $107,600 | $154,100 |
| 2020 | $3,101 | $261,700 | $107,600 | $154,100 |
| 2019 | $3,072 | $261,700 | $107,600 | $154,100 |
| 2018 | $2,882 | $233,400 | $107,600 | $125,800 |
| 2017 | $2,801 | $233,400 | $107,600 | $125,800 |
| 2016 | $2,801 | $233,400 | $107,600 | $125,800 |
| 2015 | $2,683 | $238,900 | $109,800 | $129,100 |
| 2014 | $2,640 | $238,900 | $109,800 | $129,100 |
Source: Public Records
Map
Nearby Homes
Your Personal Tour Guide
Ask me questions while you tour the home.