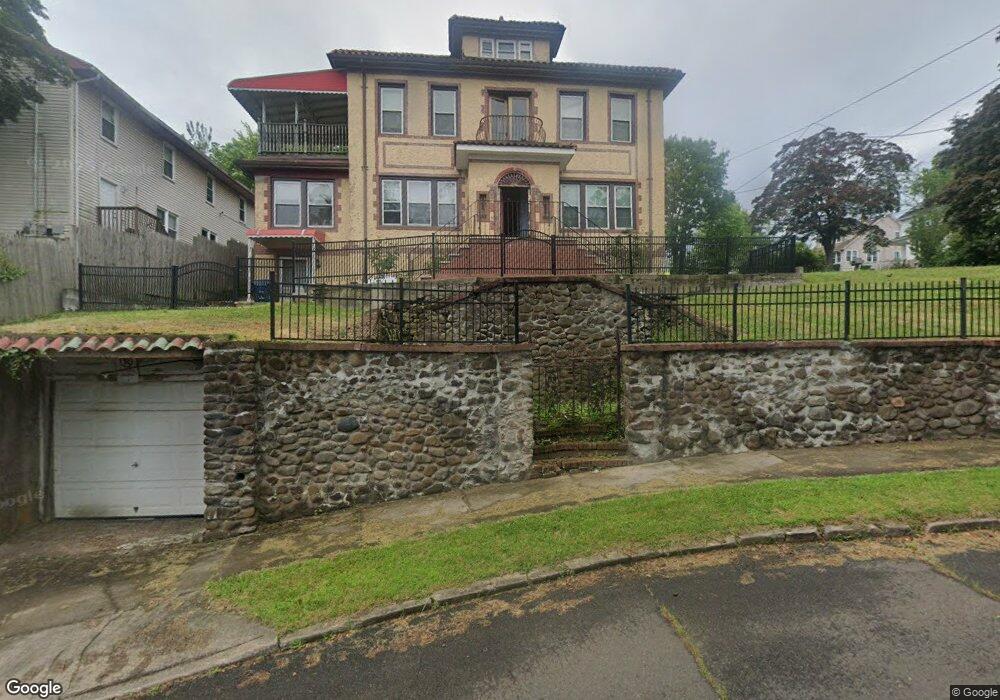
10 Brower St West Haven, CT 06516
Allingtown NeighborhoodEstimated Value: $308,000 - $526,000
5
Beds
3
Baths
3,120
Sq Ft
$144/Sq Ft
Est. Value
About This Home
This home is located at 10 Brower St, West Haven, CT 06516 and is currently estimated at $448,000, approximately $143 per square foot. 10 Brower St is a home located in New Haven County with nearby schools including Carrigan 5/6 Intermediate School, Harry M. Bailey Middle School, and West Haven High School.
Ownership History
Date
Name
Owned For
Owner Type
Purchase Details
Closed on
Nov 5, 2010
Sold by
Wells Fargo Bk and Carrington Mtg
Bought by
Wang Zongyan
Current Estimated Value
Purchase Details
Closed on
Aug 25, 2010
Sold by
Perez Jose
Bought by
Wells Fargo Bk
Purchase Details
Closed on
Nov 3, 2009
Sold by
Perez Jose and Wells Fargo Bank Na
Bought by
Wells Fargo Bank Na
Purchase Details
Closed on
Oct 27, 2005
Sold by
Quadir Abdul and Quadir Muzana
Bought by
Perez Jose
Home Financials for this Owner
Home Financials are based on the most recent Mortgage that was taken out on this home.
Original Mortgage
$239,200
Interest Rate
5.79%
Mortgage Type
Purchase Money Mortgage
Create a Home Valuation Report for This Property
The Home Valuation Report is an in-depth analysis detailing your home's value as well as a comparison with similar homes in the area
Home Values in the Area
Average Home Value in this Area
Purchase History
| Date | Buyer | Sale Price | Title Company |
|---|---|---|---|
| Wang Zongyan | $136,500 | -- | |
| Wang Zongyan | $136,500 | -- | |
| Wells Fargo Bk | -- | -- | |
| Wells Fargo Bk | -- | -- | |
| Wells Fargo Bank Na | -- | -- | |
| Wells Fargo Bank Na | -- | -- | |
| Perez Jose | $299,000 | -- | |
| Perez Jose | $299,000 | -- |
Source: Public Records
Mortgage History
| Date | Status | Borrower | Loan Amount |
|---|---|---|---|
| Previous Owner | Perez Jose | $239,200 |
Source: Public Records
Tax History Compared to Growth
Tax History
| Year | Tax Paid | Tax Assessment Tax Assessment Total Assessment is a certain percentage of the fair market value that is determined by local assessors to be the total taxable value of land and additions on the property. | Land | Improvement |
|---|---|---|---|---|
| 2025 | $11,311 | $332,570 | $66,290 | $266,280 |
| 2024 | $9,688 | $202,300 | $45,920 | $156,380 |
| 2023 | $9,391 | $202,300 | $45,920 | $156,380 |
| 2022 | $9,227 | $202,300 | $45,920 | $156,380 |
| 2021 | $9,229 | $202,300 | $45,920 | $156,380 |
| 2020 | $7,953 | $154,420 | $37,450 | $116,970 |
| 2019 | $7,829 | $154,420 | $37,450 | $116,970 |
| 2018 | $7,616 | $154,420 | $37,450 | $116,970 |
| 2017 | $7,378 | $154,420 | $37,450 | $116,970 |
| 2016 | $7,154 | $154,420 | $37,450 | $116,970 |
| 2015 | $7,696 | $189,140 | $40,040 | $149,100 |
| 2014 | $7,543 | $189,140 | $40,040 | $149,100 |
Source: Public Records
Map
Nearby Homes
- 38 Chauncey St
- 14 Homestead Ave
- 82 Hemlock St
- 22 Bristol St
- 65 Westfield St
- 103 Gilbert St
- 26 Rockdale Rd
- 31 Hinman St
- 57 Alling Street Extension
- 897 1st Ave
- 104 Terrace Ave
- 0 Burwell Rd
- 0 Burwell & Woodfield Rd Unit 24051262
- 81 Homeside Ave
- 71 Sycaway St
- 43 Clifton St
- 24 Yates St
- 194 Ella T Grasso Blvd
- 194 Homeside Ave
- 56 Highview Ave
- 2 Brower St
- 40 Brower St
- 297 Boston Post Rd
- 275 Boston Post Rd
- 46 Brower St
- 323 Boston Post Rd
- 29 Brower St
- 39 Brower St
- 50 Brower St
- 50 Brower St - 1st Floor
- 33 Brower St
- 31 Brower St
- 41 Brower St
- 41 Linde St
- 45 Brower St
- 10 Forest Rd
- 44 Orange Terrace
- 40 Orange Terrace
- 54 Orange Terrace
- 34 Orange Terrace