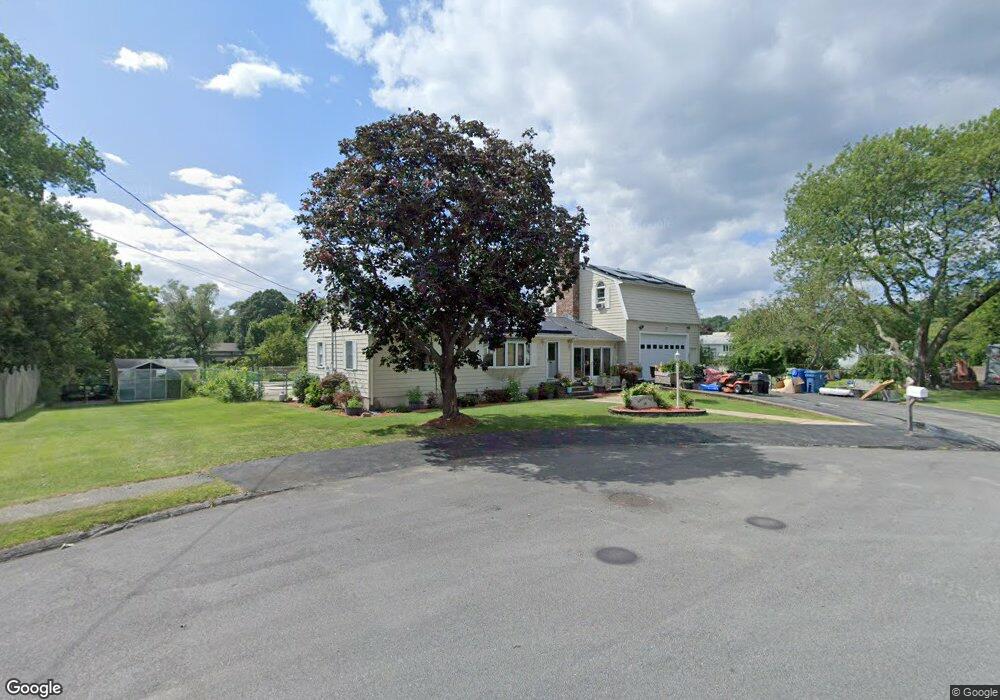
10 Bruce Rd Woburn, MA 01801
Cummingsville NeighborhoodEstimated Value: $747,000 - $851,000
2
Beds
1
Bath
1,479
Sq Ft
$532/Sq Ft
Est. Value
About This Home
This home is located at 10 Bruce Rd, Woburn, MA 01801 and is currently estimated at $786,543, approximately $531 per square foot. 10 Bruce Rd is a home located in Middlesex County with nearby schools including Hurld Elementary School, Daniel L. Joyce Middle School, and Woburn High School.
Ownership History
Date
Name
Owned For
Owner Type
Purchase Details
Closed on
Sep 8, 2003
Sold by
Farrow Pamela T
Bought by
Farrow Paul R
Current Estimated Value
Home Financials for this Owner
Home Financials are based on the most recent Mortgage that was taken out on this home.
Original Mortgage
$120,000
Outstanding Balance
$54,824
Interest Rate
6.02%
Estimated Equity
$731,719
Purchase Details
Closed on
Dec 30, 1992
Sold by
Walth Evangelical Chur
Bought by
Salar Rt and Ohnemus
Home Financials for this Owner
Home Financials are based on the most recent Mortgage that was taken out on this home.
Original Mortgage
$165,000
Interest Rate
8.32%
Mortgage Type
Purchase Money Mortgage
Create a Home Valuation Report for This Property
The Home Valuation Report is an in-depth analysis detailing your home's value as well as a comparison with similar homes in the area
Home Values in the Area
Average Home Value in this Area
Purchase History
| Date | Buyer | Sale Price | Title Company |
|---|---|---|---|
| Farrow Paul R | -- | -- | |
| Farrow Paul R | -- | -- | |
| Salar Rt | $14,500 | -- |
Source: Public Records
Mortgage History
| Date | Status | Borrower | Loan Amount |
|---|---|---|---|
| Open | Farrow Paul R | $120,000 | |
| Closed | Salar Rt | $120,000 | |
| Previous Owner | Salar Rt | $75,000 | |
| Previous Owner | Salar Rt | $165,000 | |
| Previous Owner | Salar Rt | $22,000 |
Source: Public Records
Tax History
| Year | Tax Paid | Tax Assessment Tax Assessment Total Assessment is a certain percentage of the fair market value that is determined by local assessors to be the total taxable value of land and additions on the property. | Land | Improvement |
|---|---|---|---|---|
| 2025 | $6,014 | $704,200 | $370,300 | $333,900 |
| 2024 | $5,535 | $686,700 | $352,800 | $333,900 |
| 2023 | $5,595 | $643,100 | $320,700 | $322,400 |
| 2022 | $5,464 | $585,000 | $279,200 | $305,800 |
| 2021 | $5,150 | $552,000 | $266,000 | $286,000 |
| 2020 | $4,820 | $517,200 | $266,000 | $251,200 |
| 2019 | $4,711 | $495,900 | $253,400 | $242,500 |
| 2018 | $4,592 | $464,300 | $232,700 | $231,600 |
| 2017 | $4,313 | $433,900 | $221,700 | $212,200 |
| 2016 | $4,117 | $409,700 | $207,400 | $202,300 |
| 2015 | $3,962 | $389,600 | $193,900 | $195,700 |
| 2014 | $3,706 | $355,000 | $193,900 | $161,100 |
Source: Public Records
Map
Nearby Homes
- 136 Bedford Rd
- 16 Manor Ave
- 6 Randall Dr
- 74 Hammond Place Unit 74
- 36 Cambridge Rd Unit 40
- 148 Wyman St Unit 148
- 6 Fairlawn Ave
- 4 Gangi Terrace
- 17 Wright St
- 80 N Warren St Unit 30
- 80 N Warren St Unit 31
- 16 Battlemarch Way
- 0 Johnson Rd
- 82 Lowell St
- 15 Crescent Rd
- 31 Arlington Rd Unit 1-6
- 27 Arlington Rd Unit 2
- 29 Arlington Rd Unit 3-2
- 52 Pleasant St
- 45 Lowell St
Your Personal Tour Guide
Ask me questions while you tour the home.