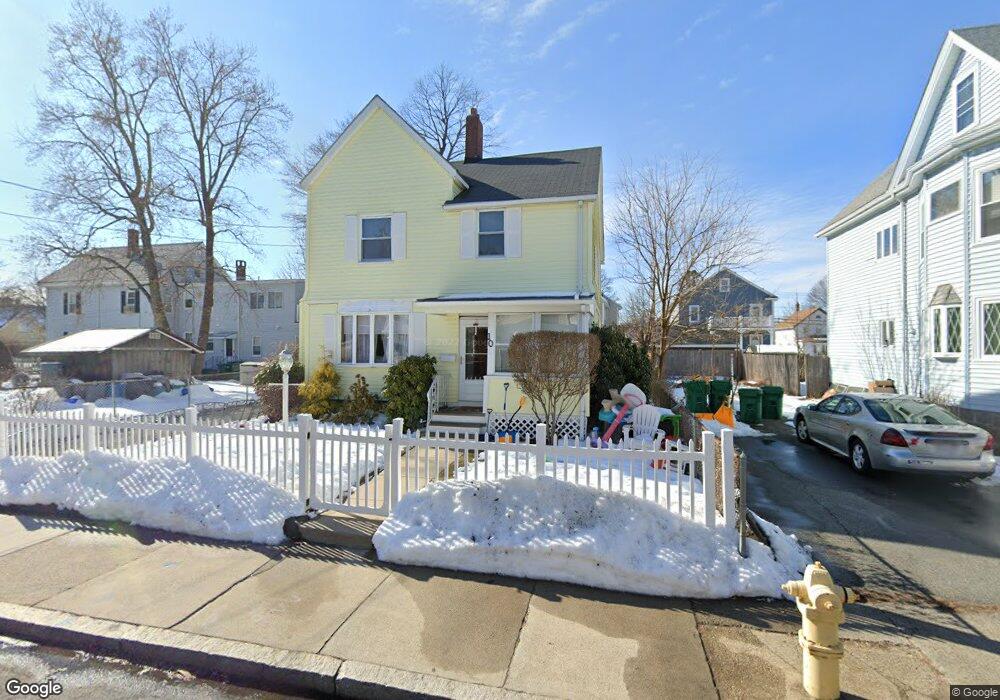
10 Burnside St Medford, MA 02155
Glenwood NeighborhoodEstimated Value: $734,000 - $825,476
3
Beds
2
Baths
1,404
Sq Ft
$558/Sq Ft
Est. Value
About This Home
This home is located at 10 Burnside St, Medford, MA 02155 and is currently estimated at $783,119, approximately $557 per square foot. 10 Burnside St is a home located in Middlesex County with nearby schools including Medford High School, Mystic Valley Regional Charter School, and St. Joseph School.
Ownership History
Date
Name
Owned For
Owner Type
Purchase Details
Closed on
Dec 23, 2010
Sold by
Angelesco Constantino
Bought by
Camuso Arthur T
Current Estimated Value
Home Financials for this Owner
Home Financials are based on the most recent Mortgage that was taken out on this home.
Original Mortgage
$170,892
Outstanding Balance
$112,617
Interest Rate
4.17%
Mortgage Type
Purchase Money Mortgage
Estimated Equity
$670,502
Create a Home Valuation Report for This Property
The Home Valuation Report is an in-depth analysis detailing your home's value as well as a comparison with similar homes in the area
Home Values in the Area
Average Home Value in this Area
Purchase History
| Date | Buyer | Sale Price | Title Company |
|---|---|---|---|
| Camuso Arthur T | $309,200 | -- |
Source: Public Records
Mortgage History
| Date | Status | Borrower | Loan Amount |
|---|---|---|---|
| Open | Camuso Arthur T | $170,892 |
Source: Public Records
Tax History Compared to Growth
Tax History
| Year | Tax Paid | Tax Assessment Tax Assessment Total Assessment is a certain percentage of the fair market value that is determined by local assessors to be the total taxable value of land and additions on the property. | Land | Improvement |
|---|---|---|---|---|
| 2025 | $5,603 | $657,600 | $325,900 | $331,700 |
| 2024 | $5,603 | $657,600 | $325,900 | $331,700 |
| 2023 | $5,400 | $624,300 | $304,500 | $319,800 |
| 2022 | $5,043 | $559,700 | $276,900 | $282,800 |
| 2021 | $5,019 | $533,400 | $263,700 | $269,700 |
| 2020 | $4,941 | $538,200 | $263,700 | $274,500 |
| 2019 | $4,764 | $496,300 | $239,700 | $256,600 |
| 2018 | $4,492 | $438,700 | $217,900 | $220,800 |
| 2017 | $4,294 | $406,600 | $203,600 | $203,000 |
| 2016 | $4,145 | $370,400 | $185,100 | $185,300 |
| 2015 | $4,074 | $348,200 | $176,300 | $171,900 |
Source: Public Records
Map
Nearby Homes
- 10 Chipman St Unit 10
- 45 Grant Ave
- 53 Sheridan Ave
- 18 Sheridan Ave
- 159 Central Ave Unit 159
- 114 Lawrence St
- 68 Central Ave Unit 306
- 216 Central Ave Unit 218
- 124 Grant Ave
- 179 Park St Unit 201
- 19 Paris St Unit 302
- 20 Ship Ave Unit 8
- 15 Walker St Unit 4
- 16 Walker St Unit 16
- 830 Fellsway
- 32 Almont St Unit 32-1
- 240 Salem St Unit 3C
- 70 Tainter St
- 70 Tainter St Unit 1
- 500 Salem St Unit 708
- 36 Lawrence St
- 36 Lawrence St Unit 2
- 12 Burnside St
- 7 Burnside St
- 7 Burnside St Unit 2
- 7 Burnside St Unit 1
- 11 Burnside St
- 16 Burnside St
- 14 Burnside St
- 46 Lawrence St
- 46 Lawrence St Unit 1
- 119 Spring St
- 125 Spring St
- 125 Spring St Unit 1
- 125 Spring St Unit 2
- 48 Lawrence St
- 121 Spring St
- 17 Burnside St Unit 1
- 17 Burnside St
- 17 Burnside St Unit 2