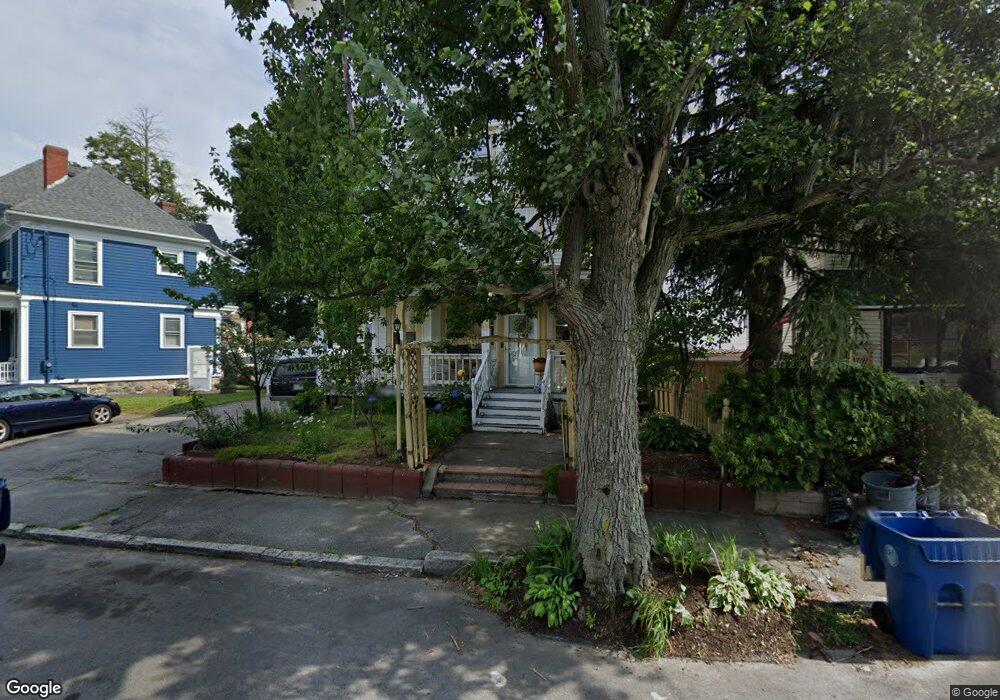
10 Buswell St Lawrence, MA 01841
Arlington NeighborhoodEstimated Value: $565,000 - $634,000
5
Beds
4
Baths
2,103
Sq Ft
$290/Sq Ft
Est. Value
About This Home
This home is located at 10 Buswell St, Lawrence, MA 01841 and is currently estimated at $610,203, approximately $290 per square foot. 10 Buswell St is a home located in Essex County with nearby schools including School For Exceptional Studies and Central Catholic High School.
Ownership History
Date
Name
Owned For
Owner Type
Purchase Details
Closed on
Mar 25, 2003
Sold by
Vega Jose and Vega Ramona
Bought by
Galvan German and Maria Magdalena
Current Estimated Value
Home Financials for this Owner
Home Financials are based on the most recent Mortgage that was taken out on this home.
Original Mortgage
$261,000
Outstanding Balance
$112,367
Interest Rate
5.9%
Mortgage Type
Purchase Money Mortgage
Estimated Equity
$497,836
Purchase Details
Closed on
Oct 28, 2002
Sold by
Vega Jose
Bought by
Vega Jose
Purchase Details
Closed on
Feb 1, 2001
Sold by
Ortega Luz C
Bought by
Vega Jose and Vega Ramona
Home Financials for this Owner
Home Financials are based on the most recent Mortgage that was taken out on this home.
Original Mortgage
$139,500
Interest Rate
7.14%
Mortgage Type
Purchase Money Mortgage
Purchase Details
Closed on
Mar 26, 1993
Sold by
Ligato Anthony E
Bought by
Ortega Luz C
Create a Home Valuation Report for This Property
The Home Valuation Report is an in-depth analysis detailing your home's value as well as a comparison with similar homes in the area
Home Values in the Area
Average Home Value in this Area
Purchase History
| Date | Buyer | Sale Price | Title Company |
|---|---|---|---|
| Galvan German | $290,000 | -- | |
| Vega Jose | -- | -- | |
| Vega Jose | $155,000 | -- | |
| Ortega Luz C | $65,000 | -- |
Source: Public Records
Mortgage History
| Date | Status | Borrower | Loan Amount |
|---|---|---|---|
| Open | Galvan German | $261,000 | |
| Previous Owner | Ortega Luz C | $41,000 | |
| Previous Owner | Ortega Luz C | $148,000 | |
| Previous Owner | Ortega Luz C | $139,500 |
Source: Public Records
Tax History
| Year | Tax Paid | Tax Assessment Tax Assessment Total Assessment is a certain percentage of the fair market value that is determined by local assessors to be the total taxable value of land and additions on the property. | Land | Improvement |
|---|---|---|---|---|
| 2025 | $4,697 | $533,800 | $110,300 | $423,500 |
| 2024 | $4,468 | $483,000 | $115,900 | $367,100 |
| 2023 | $4,510 | $443,900 | $111,900 | $332,000 |
| 2022 | $4,266 | $372,900 | $105,500 | $267,400 |
| 2021 | $4,130 | $336,600 | $105,500 | $231,100 |
| 2020 | $3,965 | $319,000 | $87,900 | $231,100 |
| 2019 | $3,847 | $281,200 | $65,400 | $215,800 |
| 2018 | $3,473 | $242,500 | $59,200 | $183,300 |
| 2017 | $3,395 | $221,300 | $56,100 | $165,200 |
| 2016 | $3,263 | $210,400 | $43,800 | $166,600 |
| 2015 | $3,181 | $210,400 | $43,800 | $166,600 |
Source: Public Records
Map
Nearby Homes
- 129-131 Lexington St
- 131A Lawrence St Unit 40
- 169 Berkeley St
- 192 Union St
- 6 Longwood Dr
- 434-438 Hampshire St
- 91 Summer St Unit 3
- 89 Newbury St Unit 89B
- 27 Willow St Unit A
- 94 Summer St
- 2 Oak Knoll Rd
- 24 Boylston St
- 32 Orchard St
- 11 Lawrence St Unit 606
- 82 Oakside Ave
- 40 Fairmont St
- 144 Ferry St
- 24 Court St
- 15 Swan Ave
- 10 Holly St
- 14 Buswell St Unit 16
- 97 Knox St
- 101 Knox St
- 61-63 Thorndike St
- 61 Thorndike St Unit 63
- 18 Buswell St
- 3 Buswell St
- 5 Buswell St
- 20 Buswell St Unit 22
- 250 Thorndike St
- 49 Thorndike St
- 65 Thorndike St Unit 67
- 89 Knox St
- 15 Allyn Terrace Unit 17
- 90 Knox St
- 9 Buswell St Unit 11
- 9 Allyn Terrace
- 58 Thorndike St
- 50 Thorndike St
- 62 Thorndike St