10 Buswell St Lawrence, MA 01841
Arlington NeighborhoodEstimated Value: $514,000 - $777,000
About This Home
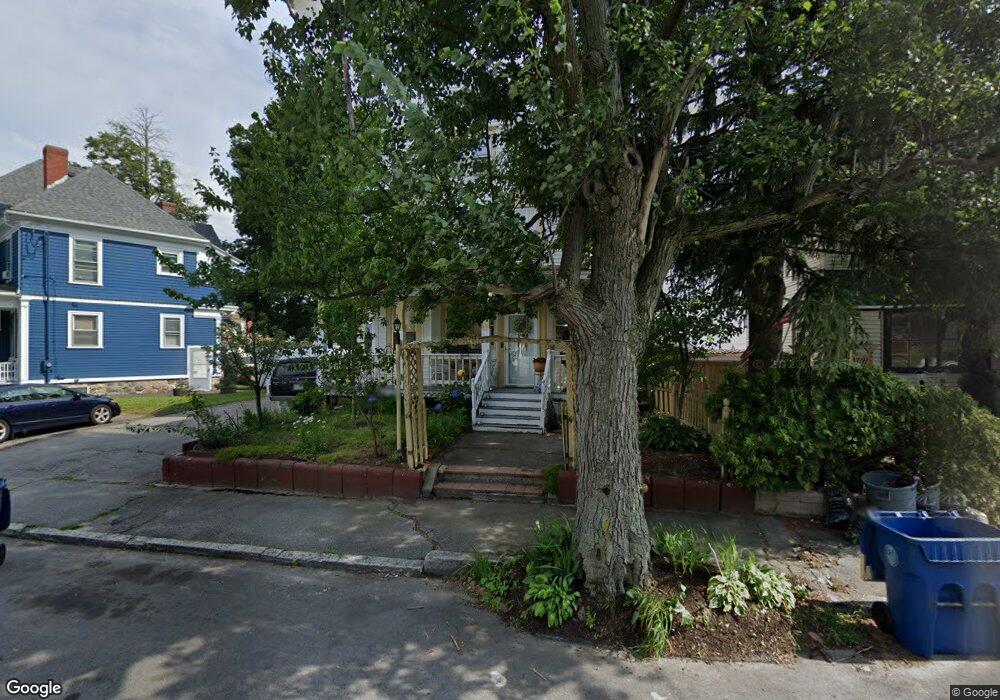
This home is located at 10 Buswell St, Lawrence, MA 01841 and is currently estimated at $647,761, approximately $308 per square foot. 10 Buswell St is a home located in Essex County with nearby schools including School For Exceptional Studies and Central Catholic High School.
Ownership History
We collect this data history from publicly available records. To have your information removed, we recommend requesting removal directly through your county’s website.
Purchase Details
Home Financials for this Owner
Home Financials are based on the most recent Mortgage that was taken out on this home.Purchase Details
Purchase Details
Purchase Details
Home Values in the Area
Average Home Value in this Area
Purchase History
We collect this data history from publicly available records. To have your information removed, we recommend requesting removal directly through your county’s website.
| Date | Buyer | Sale Price | Title Company |
|---|---|---|---|
| $290,000 | -- | ||
| -- | -- | ||
| $155,000 | -- | ||
| $65,000 | -- |
Mortgage History
We collect this data history from publicly available records. To have your information removed, we recommend requesting removal directly through your county’s website.
| Date | Status | Borrower | Loan Amount |
|---|---|---|---|
| Open | $261,000 | ||
| Previous Owner | $41,000 | ||
| Previous Owner | $148,000 |
Tax History
We collect this data history from publicly available records. To have your information removed, we recommend requesting removal directly through your county’s website.
| Year | Tax Paid | Tax Assessment Tax Assessment Total Assessment is a certain percentage of the fair market value that is determined by local assessors to be the total taxable value of land and additions on the property. | Land | Improvement |
|---|---|---|---|---|
| 2025 | $4,697 | $533,800 | $110,300 | $423,500 |
| 2024 | $4,468 | $483,000 | $115,900 | $367,100 |
| 2023 | $4,510 | $443,900 | $111,900 | $332,000 |
| 2022 | $4,266 | $372,900 | $105,500 | $267,400 |
| 2021 | $4,130 | $336,600 | $105,500 | $231,100 |
| 2020 | $3,965 | $319,000 | $87,900 | $231,100 |
| 2019 | $3,847 | $281,200 | $65,400 | $215,800 |
| 2018 | $3,473 | $242,500 | $59,200 | $183,300 |
| 2017 | $3,395 | $221,300 | $56,100 | $165,200 |
| 2016 | $3,263 | $210,400 | $43,800 | $166,600 |
| 2015 | $3,181 | $210,400 | $43,800 | $166,600 |
Map
- 15-17 Allyn Terrace
- 10 Swan St
- 15 Bunkerhill St
- 229 Jackson St
- 106 E Haverhill St
- 16 Quincy St
- 171 Ferry St
- 4 Chelmsford St
- 71-75 Common St
- 40-42 Holly St
- 22 Camden St Unit A
- 11 Lawrence St Unit 510
- 168 Jackson St
- 22 Lippold St
- 172 High St
- 46 Amesbury St Unit 2B
- 155-157 Tenney St
- 46 Tudor St
- 2 Bailey St
- 106-110 Tremont St
- 14 Buswell St Unit 16
- 97 Knox St
- 101 Knox St
- 61-63 Thorndike St
- 61 Thorndike St Unit 63
- 18 Buswell St
- 3 Buswell St
- 5 Buswell St
- 20 Buswell St Unit 22
- 250 Thorndike St
- 49 Thorndike St
- 65 Thorndike St Unit 67
- 89 Knox St
- 15 Allyn Terrace Unit 17
- 90 Knox St
- 9 Buswell St Unit 11
- 58 Thorndike St
- 9 Allyn Terrace
- 50 Thorndike St
- 62 Thorndike St
Ask me questions while you tour the home.