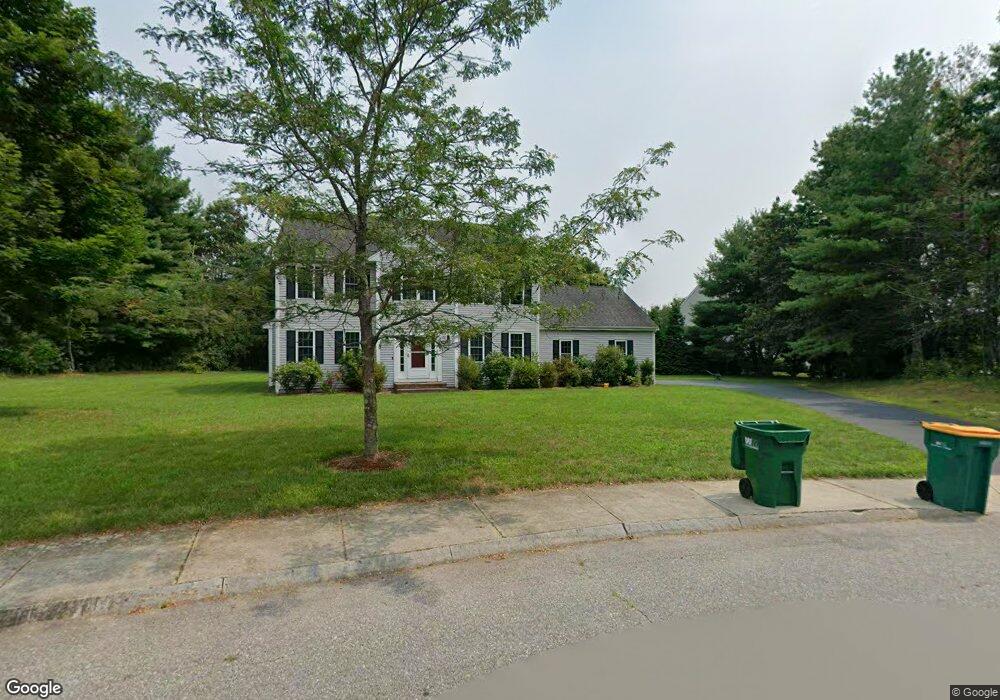
10 Camden Ln Mansfield, MA 02048
Estimated Value: $797,000 - $873,671
4
Beds
3
Baths
2,208
Sq Ft
$379/Sq Ft
Est. Value
About This Home
This home is located at 10 Camden Ln, Mansfield, MA 02048 and is currently estimated at $837,557, approximately $379 per square foot. 10 Camden Ln is a home located in Bristol County with nearby schools including Everett W. Robinson Elementary School, Jordan/Jackson Elementary School, and Harold L. Qualters Middle School.
Ownership History
Date
Name
Owned For
Owner Type
Purchase Details
Closed on
Jul 25, 2013
Sold by
Christopher & Feck Dev C
Bought by
Macha Rajesh and Macha Padmavathi
Current Estimated Value
Home Financials for this Owner
Home Financials are based on the most recent Mortgage that was taken out on this home.
Original Mortgage
$404,000
Outstanding Balance
$283,018
Interest Rate
3%
Mortgage Type
Adjustable Rate Mortgage/ARM
Estimated Equity
$554,539
Purchase Details
Closed on
Feb 8, 2013
Sold by
Christian & Feck Dev Cop
Bought by
Meelia Christopher
Purchase Details
Closed on
May 17, 2010
Sold by
Green Tr Acres Llc
Bought by
Christian & Feck Dev Cor
Home Financials for this Owner
Home Financials are based on the most recent Mortgage that was taken out on this home.
Original Mortgage
$1,532,250
Interest Rate
5.11%
Mortgage Type
Purchase Money Mortgage
Create a Home Valuation Report for This Property
The Home Valuation Report is an in-depth analysis detailing your home's value as well as a comparison with similar homes in the area
Home Values in the Area
Average Home Value in this Area
Purchase History
| Date | Buyer | Sale Price | Title Company |
|---|---|---|---|
| Macha Rajesh | $585,000 | -- | |
| Meelia Christopher | $228,000 | -- | |
| Christian & Feck Dev Cor | $925,000 | -- |
Source: Public Records
Mortgage History
| Date | Status | Borrower | Loan Amount |
|---|---|---|---|
| Open | Macha Rajesh | $404,000 | |
| Previous Owner | Christian & Feck Dev Cor | $1,532,250 |
Source: Public Records
Tax History Compared to Growth
Tax History
| Year | Tax Paid | Tax Assessment Tax Assessment Total Assessment is a certain percentage of the fair market value that is determined by local assessors to be the total taxable value of land and additions on the property. | Land | Improvement |
|---|---|---|---|---|
| 2025 | $9,663 | $733,700 | $260,200 | $473,500 |
| 2024 | $9,711 | $719,300 | $272,000 | $447,300 |
| 2023 | $9,332 | $662,300 | $272,000 | $390,300 |
| 2022 | $8,956 | $590,400 | $251,800 | $338,600 |
| 2021 | $9,182 | $597,800 | $237,300 | $360,500 |
| 2020 | $9,035 | $588,200 | $237,300 | $350,900 |
| 2019 | $8,799 | $578,100 | $220,400 | $357,700 |
| 2018 | $8,741 | $561,400 | $210,200 | $351,200 |
| 2017 | $8,195 | $545,600 | $204,100 | $341,500 |
| 2016 | $8,312 | $539,400 | $223,700 | $315,700 |
| 2015 | $8,111 | $523,300 | $223,700 | $299,600 |
Source: Public Records
Map
Nearby Homes
- 2 Oak St Unit 2D
- 2 Oak St Unit 2A
- 2 Oak St Unit 2C
- 2 Oak St Unit 2B
- 176 Elm St
- 37 Oakleaf Dr
- 451R Gilbert St
- 14 Country Club Way
- 150 Gilbert St
- 255 Mckeon Dr
- 4 Buckskin Dr
- 250 Mansfield Ave Unit 66
- 4 Village Way Unit F
- 157 Mansfield Ave Unit 14
- 15 Reservoir St Unit 44
- 19 Precourt Ln
- 18 Columbine Rd
- 24 Maverick Dr
- 933 Pleasant St
- 231 Spring St