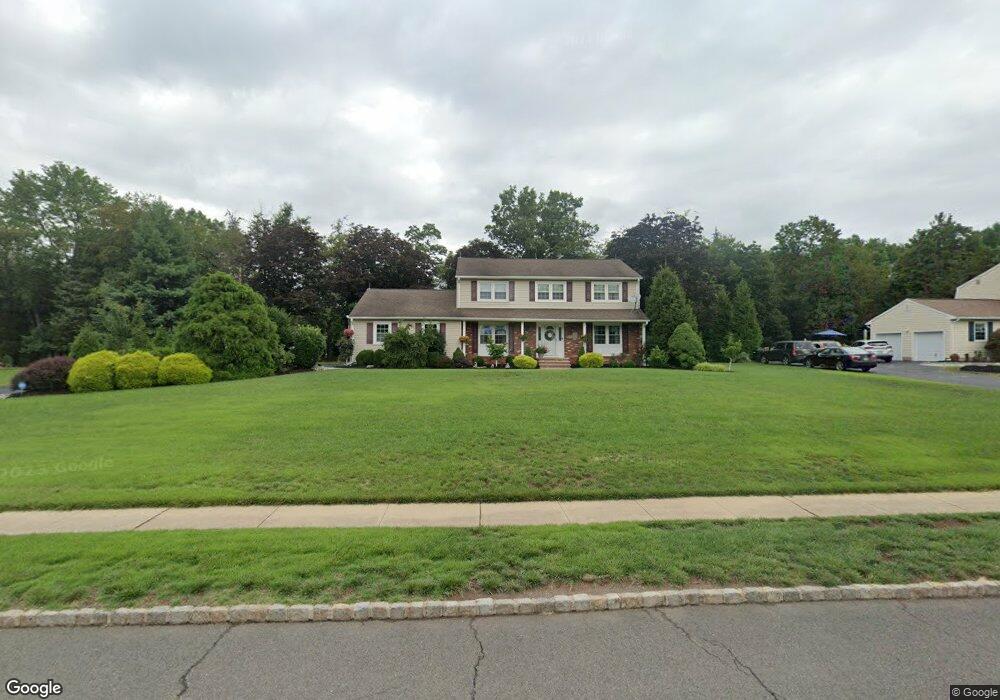
10 Camden Rd Hillsborough, NJ 08844
Estimated Value: $786,361 - $852,000
--
Bed
--
Bath
2,650
Sq Ft
$312/Sq Ft
Est. Value
About This Home
This home is located at 10 Camden Rd, Hillsborough, NJ 08844 and is currently estimated at $827,840, approximately $312 per square foot. 10 Camden Rd is a home located in Somerset County with nearby schools including Hillsborough High School and Brighthorizons at Hillsborough.
Ownership History
Date
Name
Owned For
Owner Type
Purchase Details
Closed on
Jan 24, 2019
Sold by
Mucha Stanislaw
Bought by
Mucha Stanislaw and Mucha Karen
Current Estimated Value
Purchase Details
Closed on
Oct 17, 2018
Sold by
Mucha Stanislaw and Kraft Ingrid
Bought by
Mucha Stanislaw
Purchase Details
Closed on
Jul 28, 1997
Sold by
Mcclelland Robert
Bought by
Mucha Karen and Irma Mucha
Home Financials for this Owner
Home Financials are based on the most recent Mortgage that was taken out on this home.
Original Mortgage
$90,000
Interest Rate
7.52%
Create a Home Valuation Report for This Property
The Home Valuation Report is an in-depth analysis detailing your home's value as well as a comparison with similar homes in the area
Home Values in the Area
Average Home Value in this Area
Purchase History
| Date | Buyer | Sale Price | Title Company |
|---|---|---|---|
| Mucha Stanislaw | -- | None Available | |
| Mucha Stanislaw | -- | None Available | |
| Mucha Karen | $250,000 | -- |
Source: Public Records
Mortgage History
| Date | Status | Borrower | Loan Amount |
|---|---|---|---|
| Previous Owner | Mucha Karen | $90,000 |
Source: Public Records
Tax History Compared to Growth
Tax History
| Year | Tax Paid | Tax Assessment Tax Assessment Total Assessment is a certain percentage of the fair market value that is determined by local assessors to be the total taxable value of land and additions on the property. | Land | Improvement |
|---|---|---|---|---|
| 2025 | $14,060 | $705,700 | $370,300 | $335,400 |
| 2024 | $14,060 | $656,100 | $365,300 | $290,800 |
| 2023 | $13,086 | $607,800 | $315,300 | $292,500 |
| 2022 | $12,628 | $565,500 | $280,300 | $285,200 |
| 2021 | $11,958 | $509,300 | $235,300 | $274,000 |
| 2020 | $11,941 | $500,900 | $225,300 | $275,600 |
| 2019 | $11,840 | $492,500 | $215,300 | $277,200 |
| 2018 | $11,522 | $476,300 | $205,300 | $271,000 |
| 2017 | $10,469 | $433,500 | $185,300 | $248,200 |
| 2016 | $10,501 | $435,000 | $185,300 | $249,700 |
| 2015 | $10,420 | $437,100 | $185,300 | $251,800 |
| 2014 | $10,573 | $453,000 | $185,300 | $267,700 |
Source: Public Records
Map
Nearby Homes