Estimated Value: $394,490 - $556,000
--
Bed
1
Bath
2,991
Sq Ft
$160/Sq Ft
Est. Value
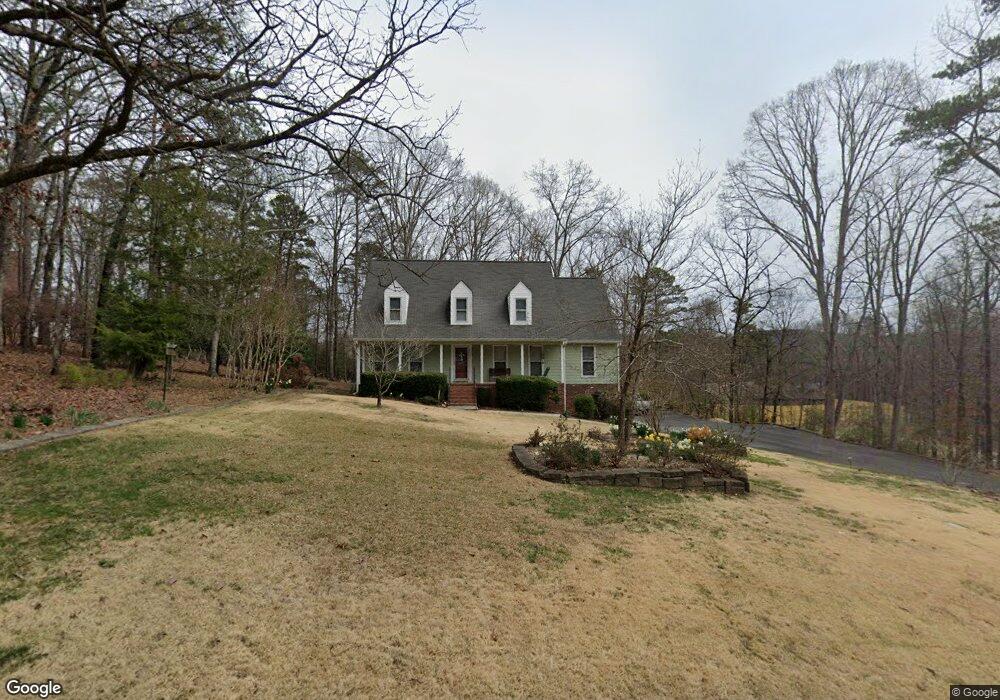
About This Home
This home is located at 10 Canterbury Place SW, Rome, GA 30165 and is currently estimated at $477,623, approximately $159 per square foot. 10 Canterbury Place SW is a home located in Floyd County with nearby schools including Coosa Middle School and Coosa High School.
Ownership History
Date
Name
Owned For
Owner Type
Purchase Details
Closed on
Apr 4, 2001
Sold by
Terrell Stanley P and Terrell Peggy B
Bought by
Lee Jerry M and Lee Mary W
Current Estimated Value
Purchase Details
Closed on
Aug 10, 1992
Sold by
Terrell Stanley P
Bought by
Terrell Stanley P and Terrell Peggy B
Purchase Details
Closed on
Aug 9, 1991
Sold by
Vandenabeele Maria C and Vandro Bondewyn L
Bought by
Terrell Stanley P
Purchase Details
Closed on
Dec 31, 1987
Sold by
Campbell Alla Traber
Bought by
Vandenabeele Maria C and Vandenabeele Bondewyn L
Purchase Details
Closed on
Sep 5, 1980
Sold by
Campbell Charles A and Campbell Alla T
Bought by
Campbell Alla Traber
Purchase Details
Closed on
Aug 6, 1980
Sold by
Mayes Walter T
Bought by
Campbell Charles A and Campbell Alla T
Purchase Details
Closed on
Mar 26, 1980
Sold by
Sheron Toles Inc
Bought by
Mayes Walter T
Purchase Details
Closed on
May 19, 1972
Bought by
Sheron Toles Inc
Create a Home Valuation Report for This Property
The Home Valuation Report is an in-depth analysis detailing your home's value as well as a comparison with similar homes in the area
Home Values in the Area
Average Home Value in this Area
Purchase History
| Date | Buyer | Sale Price | Title Company |
|---|---|---|---|
| Lee Jerry M | $205,000 | -- | |
| Terrell Stanley P | -- | -- | |
| Terrell Stanley P | $160,000 | -- | |
| Vandenabeele Maria C | $140,000 | -- | |
| Campbell Alla Traber | $115,000 | -- | |
| Campbell Charles A | $117,000 | -- | |
| Mayes Walter T | -- | -- | |
| Sheron Toles Inc | -- | -- |
Source: Public Records
Tax History Compared to Growth
Tax History
| Year | Tax Paid | Tax Assessment Tax Assessment Total Assessment is a certain percentage of the fair market value that is determined by local assessors to be the total taxable value of land and additions on the property. | Land | Improvement |
|---|---|---|---|---|
| 2024 | $2,989 | $151,142 | $27,051 | $124,091 |
| 2023 | $2,995 | $145,858 | $24,592 | $121,266 |
| 2022 | $2,577 | $121,593 | $20,394 | $101,199 |
| 2021 | $2,405 | $110,042 | $18,584 | $91,458 |
| 2020 | $2,426 | $110,409 | $16,160 | $94,249 |
| 2019 | $2,310 | $106,316 | $16,160 | $90,156 |
| 2018 | $2,217 | $101,276 | $15,391 | $85,885 |
| 2017 | $2,137 | $96,706 | $14,251 | $82,455 |
| 2016 | $2,050 | $90,640 | $14,240 | $76,400 |
| 2015 | $2,728 | $91,945 | $14,240 | $77,705 |
| 2014 | $2,728 | $91,945 | $14,240 | $77,705 |
Source: Public Records
Map
Nearby Homes
- 10 Horseshoe Bend Rd SW
- 2 Kensington Rd SW
- 1 Windsor Rd SW
- 30 Fairview Dr SW
- 1 Huntington Rd SW
- 0 Belle Meade Dr SW Unit 10504645
- 5 Saint Andrews Way SW
- 0 Radio Springs Rd SW Unit 10587646
- 0 Radio Springs Rd SW Unit 10587644
- 0 Radio Springs Rd SW Unit 10587642
- 11 Brow Rd SW
- 0 Hidden Ridge Dr Unit 10556470
- 0 Hidden Ridge Dr Unit 10343706
- 0 Hidden Ridge Dr Unit 10343701
- 0 Hidden Ridge Dr Unit 10343700
- 0 Hidden Ridge Dr Unit 10343696
- 0 Hidden Ridge Dr Unit 10343694
- 0 Hidden Ridge Dr Unit 10343693
- 0 Hidden Ridge Dr Unit 10343689
- 0 Hidden Ridge Dr Unit 10343688
- 12 Canterbury Place SW
- 8 Canterbury Place SW
- 7 Canterbury Place SW
- 36 Huntington Rd SW
- 11 Canterbury Place SW
- 14 Canterbury Place SW
- 38 Huntington Rd SW
- 5 Canterbury Place SW
- 9 Canterbury Place SW
- 34 Huntington Rd SW Unit 30
- 34 Huntington Rd SW
- 3 Canterbury Place SW
- 40 Huntington Rd SW
- 0 Canterbury Place SW Unit 7491532
- 0 Canterbury Place SW Unit 7179984
- 0 Canterbury Place SW Unit 8775731
- 0 Canterbury Place SW Unit 7061209
- 0 Canterbury Place SW Unit 3124050
- 0 Canterbury Place SW Unit 2676461
- 0 Canterbury Place SW