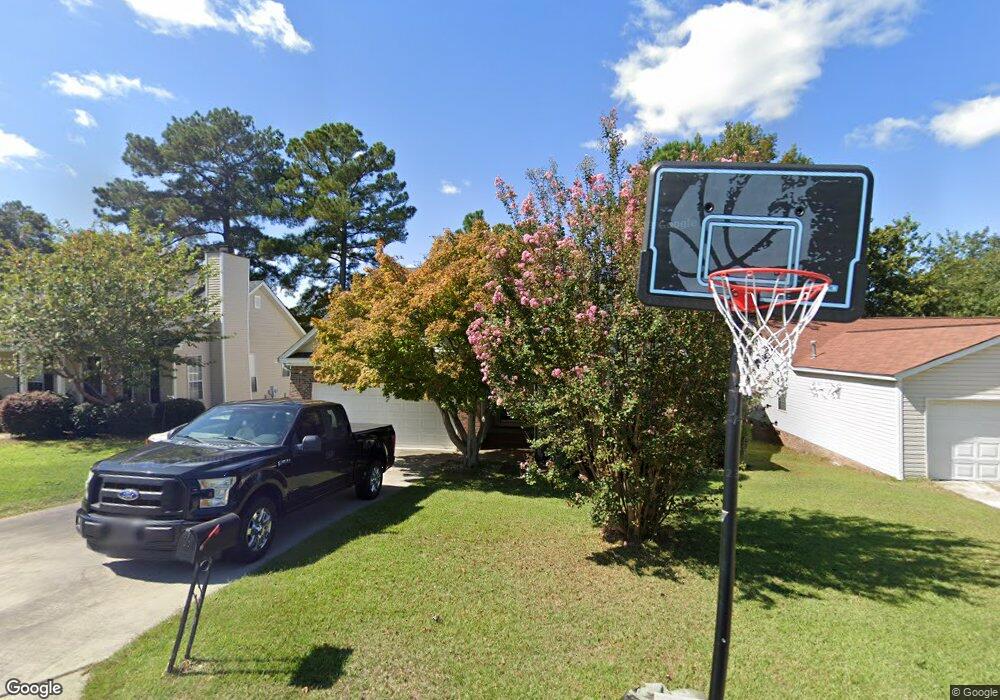
10 Carriage Oaks Ct Columbia, SC 29229
Northeast Columbia NeighborhoodEstimated Value: $194,000 - $226,000
3
Beds
2
Baths
1,583
Sq Ft
$135/Sq Ft
Est. Value
About This Home
This home is located at 10 Carriage Oaks Ct, Columbia, SC 29229 and is currently estimated at $213,667, approximately $134 per square foot. 10 Carriage Oaks Ct is a home located in Richland County with nearby schools including North Springs Elementary School, Summit Parkway Middle School, and Ridge View High School.
Ownership History
Date
Name
Owned For
Owner Type
Purchase Details
Closed on
Jul 21, 2006
Sold by
Bouldin Elizabeth and Bouldin Ronald
Bought by
Williamson Craig Steven
Current Estimated Value
Home Financials for this Owner
Home Financials are based on the most recent Mortgage that was taken out on this home.
Original Mortgage
$129,730
Outstanding Balance
$76,805
Interest Rate
6.6%
Mortgage Type
VA
Estimated Equity
$136,862
Purchase Details
Closed on
Sep 24, 1999
Sold by
Puthoff David B and Puthoff Karen D
Bought by
Bouldin Ronald and Bouldin Elizabeth
Home Financials for this Owner
Home Financials are based on the most recent Mortgage that was taken out on this home.
Original Mortgage
$109,850
Interest Rate
7.89%
Mortgage Type
VA
Create a Home Valuation Report for This Property
The Home Valuation Report is an in-depth analysis detailing your home's value as well as a comparison with similar homes in the area
Home Values in the Area
Average Home Value in this Area
Purchase History
| Date | Buyer | Sale Price | Title Company |
|---|---|---|---|
| Williamson Craig Steven | $127,000 | None Available | |
| Bouldin Ronald | $107,725 | -- |
Source: Public Records
Mortgage History
| Date | Status | Borrower | Loan Amount |
|---|---|---|---|
| Open | Williamson Craig Steven | $129,730 | |
| Previous Owner | Bouldin Ronald | $109,850 |
Source: Public Records
Tax History Compared to Growth
Tax History
| Year | Tax Paid | Tax Assessment Tax Assessment Total Assessment is a certain percentage of the fair market value that is determined by local assessors to be the total taxable value of land and additions on the property. | Land | Improvement |
|---|---|---|---|---|
| 2023 | $386 | $0 | $0 | $0 |
| 2021 | $324 | $4,468 | $876 | $3,592 |
| 2020 | $324 | $0 | $0 | $0 |
| 2019 | $286 | $0 | $0 | $0 |
| 2018 | $1,070 | $3,700 | $0 | $0 |
| 2017 | $1,051 | $3,700 | $0 | $0 |
| 2016 | $1,048 | $3,700 | $0 | $0 |
| 2015 | $1,051 | $3,700 | $0 | $0 |
| 2014 | $1,049 | $92,600 | $0 | $0 |
| 2013 | -- | $3,700 | $0 | $0 |
Source: Public Records
Map
Nearby Homes
- 423 Oak Manor Dr
- 106 Oak Manor Dr
- 32 Carriage Oaks Ct
- 206 Carriage Oaks Dr
- 7 Bridle Path Ct
- 250 Curvewood Rd
- 6 Newgate End
- 113 Parsons Mill Ln
- 610 Wetherbrooke Way
- 608 Wetherbrooke Way
- 606 Wetherbrooke Way
- 517 Adelaide Ct
- 515 Adelaide Ct
- 513 Adelaide Ct
- 511 Aedlaide Ct
- 509 Adelaide Ct
- 601 Weatherbrook Way
- 607 Weatherbrook Way
- 309 Underhill Dr
- 314 Underhill Dr
- 8 Carriage Oaks Ct
- 12 Carriage Oaks Ct
- 10 Surrey Ln
- 16 Carriage Oaks Ct
- 8 Surrey Ln
- 4 Carriage Oaks Ct
- 8 Surrey Ln
- 11 Carriage Oaks Ct
- 9 Carriage Oaks Ct
- 13 Carriage Oaks Ct
- 20 Carriage Oaks Ct
- 15 Carriage Oaks Ct
- 112 Oak Manor Dr
- 7 Carriage Oaks Ct
- 6 Surrey Ln
- 12 Surrey Ln
- 114 Oak Manor Dr
- 17 Carriage Oaks Ct
- 116 Oak Manor Dr
- 24 Carriage Oaks Ct