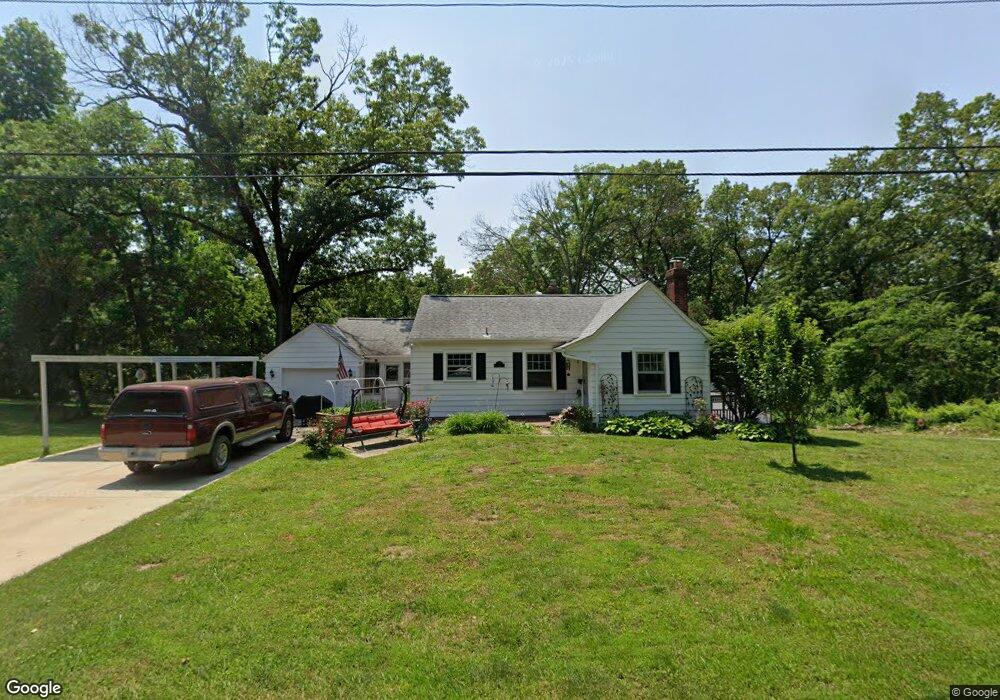
10 Carson Dr Belleville, IL 62223
Estimated Value: $99,000 - $158,000
2
Beds
2
Baths
949
Sq Ft
$136/Sq Ft
Est. Value
About This Home
This home is located at 10 Carson Dr, Belleville, IL 62223 and is currently estimated at $129,270, approximately $136 per square foot. 10 Carson Dr is a home located in St. Clair County with nearby schools including Ellis Elementary School, Emge Junior High School, and Blessed Sacrament Catholic School.
Ownership History
Date
Name
Owned For
Owner Type
Purchase Details
Closed on
May 8, 2025
Sold by
Robertson Bruce
Bought by
Robertson Bruce and Robertson Kimberly
Current Estimated Value
Home Financials for this Owner
Home Financials are based on the most recent Mortgage that was taken out on this home.
Original Mortgage
$50,000
Outstanding Balance
$49,836
Interest Rate
7.04%
Mortgage Type
New Conventional
Estimated Equity
$79,434
Purchase Details
Closed on
Jun 30, 2010
Sold by
Dettmer Brooke
Bought by
Robertson Bruce W
Home Financials for this Owner
Home Financials are based on the most recent Mortgage that was taken out on this home.
Original Mortgage
$51,410
Interest Rate
4.63%
Mortgage Type
New Conventional
Purchase Details
Closed on
Mar 16, 2005
Sold by
Workman Gloria L and Workman Wesley Roy
Bought by
Workman Gloria L
Create a Home Valuation Report for This Property
The Home Valuation Report is an in-depth analysis detailing your home's value as well as a comparison with similar homes in the area
Home Values in the Area
Average Home Value in this Area
Purchase History
| Date | Buyer | Sale Price | Title Company |
|---|---|---|---|
| Robertson Bruce | -- | None Available | |
| Robertson Bruce W | $53,000 | Town & Country Title Co | |
| Workman Gloria L | -- | -- |
Source: Public Records
Mortgage History
| Date | Status | Borrower | Loan Amount |
|---|---|---|---|
| Open | Robertson Bruce | $50,000 | |
| Previous Owner | Robertson Bruce W | $51,410 |
Source: Public Records
Tax History
| Year | Tax Paid | Tax Assessment Tax Assessment Total Assessment is a certain percentage of the fair market value that is determined by local assessors to be the total taxable value of land and additions on the property. | Land | Improvement |
|---|---|---|---|---|
| 2024 | $2,679 | $37,889 | $7,163 | $30,726 |
| 2023 | $2,451 | $33,996 | $6,427 | $27,569 |
| 2022 | $2,276 | $30,849 | $5,832 | $25,017 |
| 2021 | $2,152 | $28,641 | $5,415 | $23,226 |
| 2020 | $2,245 | $28,720 | $5,268 | $23,452 |
| 2019 | $2,227 | $28,720 | $5,268 | $23,452 |
| 2018 | $2,136 | $27,444 | $5,034 | $22,410 |
| 2017 | $1,597 | $25,560 | $4,689 | $20,871 |
| 2016 | $1,127 | $17,304 | $5,240 | $12,064 |
| 2014 | $1,034 | $17,403 | $5,270 | $12,133 |
| 2013 | $3,000 | $18,567 | $5,622 | $12,945 |
Source: Public Records
Map
Nearby Homes
Your Personal Tour Guide
Ask me questions while you tour the home.