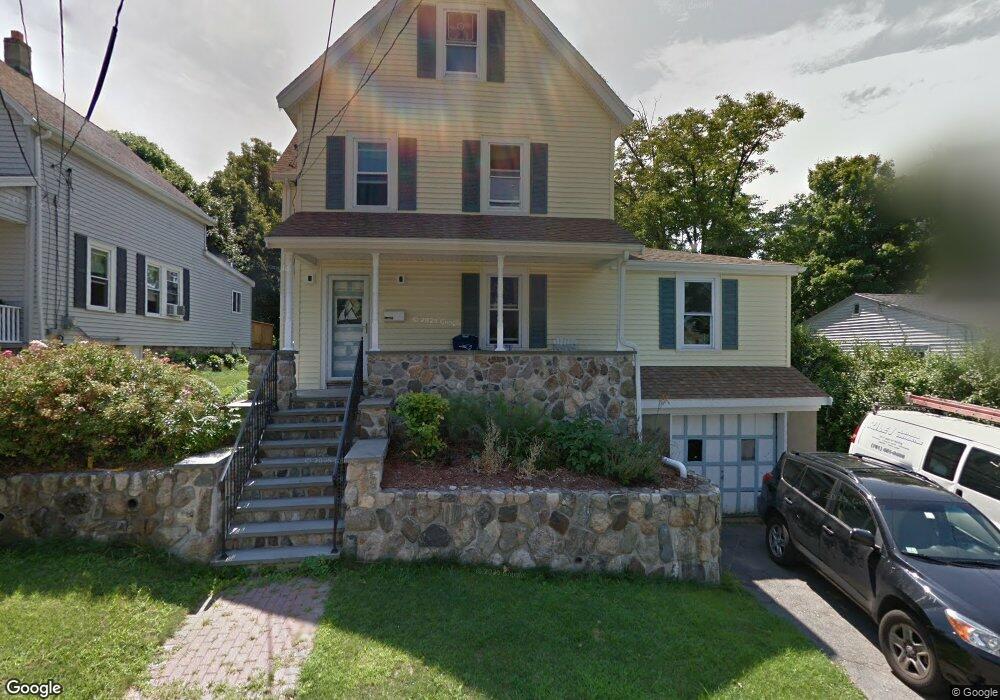
10 Carter St Woburn, MA 01801
Downtown Woburn NeighborhoodEstimated Value: $684,317 - $1,027,000
3
Beds
2
Baths
999,999
Sq Ft
$1/Sq Ft
Est. Value
About This Home
This home is located at 10 Carter St, Woburn, MA 01801 and is currently estimated at $805,829, approximately $0 per square foot. 10 Carter St is a home located in Middlesex County with nearby schools including Goodyear Elementary School, Daniel L. Joyce Middle School, and Woburn High School.
Ownership History
Date
Name
Owned For
Owner Type
Purchase Details
Closed on
Feb 3, 2026
Sold by
Riley Andrew and Riley Evelyn E
Bought by
Evelyn E Riley and Evelyn Riley
Current Estimated Value
Purchase Details
Closed on
Dec 4, 2012
Sold by
Riley Andrew
Bought by
Riley Andrew and Riley Evelyn
Purchase Details
Closed on
Jan 10, 2002
Sold by
Hoarty Thomas and Hoarty Kristine
Bought by
Riley Andrew
Home Financials for this Owner
Home Financials are based on the most recent Mortgage that was taken out on this home.
Original Mortgage
$234,000
Interest Rate
7.04%
Mortgage Type
Purchase Money Mortgage
Create a Home Valuation Report for This Property
The Home Valuation Report is an in-depth analysis detailing your home's value as well as a comparison with similar homes in the area
Home Values in the Area
Average Home Value in this Area
Purchase History
We collect this data history from publicly available records. To have your information removed, we recommend requesting removal directly through your county’s website.
| Date | Buyer | Sale Price | Title Company |
|---|---|---|---|
| Evelyn E Riley | -- | -- | |
| Riley Andrew | -- | -- | |
| Riley Andrew C | -- | -- | |
| Riley Andrew C | -- | -- | |
| Riley Andrew | $260,000 | -- | |
| Riley Andrew C | $260,000 | -- |
Source: Public Records
Mortgage History
We collect this data history from publicly available records. To have your information removed, we recommend requesting removal directly through your county’s website.
| Date | Status | Borrower | Loan Amount |
|---|---|---|---|
| Previous Owner | Riley Andrew C | $234,000 |
Source: Public Records
Tax History
| Year | Tax Paid | Tax Assessment Tax Assessment Total Assessment is a certain percentage of the fair market value that is determined by local assessors to be the total taxable value of land and additions on the property. | Land | Improvement |
|---|---|---|---|---|
| 2025 | $5,060 | $592,500 | $276,300 | $316,200 |
| 2024 | $4,604 | $571,200 | $263,100 | $308,100 |
| 2023 | $4,648 | $534,300 | $239,200 | $295,100 |
| 2022 | $4,396 | $470,700 | $208,000 | $262,700 |
| 2021 | $4,288 | $459,600 | $198,100 | $261,500 |
| 2020 | $3,905 | $419,000 | $198,100 | $220,900 |
| 2019 | $3,614 | $380,400 | $188,600 | $191,800 |
| 2018 | $3,542 | $358,100 | $173,100 | $185,000 |
| 2017 | $3,188 | $320,700 | $164,800 | $155,900 |
| 2016 | $2,985 | $297,000 | $154,100 | $142,900 |
| 2015 | $2,918 | $286,900 | $144,000 | $142,900 |
| 2014 | $2,710 | $259,600 | $144,000 | $115,600 |
Source: Public Records
Map
Nearby Homes
- 12 Highland Ave
- 0 Mount Pleasant St
- 3 Conn St Unit 3
- 380 Cross St
- 201 Main St Unit 31
- 69r Eastern Ave
- 6 Richmond Park
- 20 Buck St
- 18-20 Buck St Unit 1
- 44 Warren Ave Unit B
- 16 Glenwood Ave
- 22 Arthur St
- 35 Montvale Ave Unit 3
- 7 Prospect St
- 31 Montvale Ave Unit 2
- 7 Sherman Place
- 237 Swanton St
- 55 Brookside Ave
- 28 Everett St
- 41 Cross St
- 99 Garfield Ave
- 99 Garfield Ave Unit B
- 99 Garfield Ave Unit Main House
- 99 Garfield Ave Unit A
- 99 Garfield Ave Unit 99B
- 97 Garfield Ave
- 97 Garfield Ave Unit A
- 103 Garfield Ave
- 82 Mount Pleasant St
- 3 Carter St
- 95 Garfield Ave
- 80 Mount Pleasant St
- 112 Garfield Ave
- 108 Garfield Ave
- 116 Garfield Ave
- 93 Garfield Ave
- 106 Garfield Ave
- 2 Carter St
- 4 Playstead Ave
- 7 Carter St
Your Personal Tour Guide
Ask me questions while you tour the home.