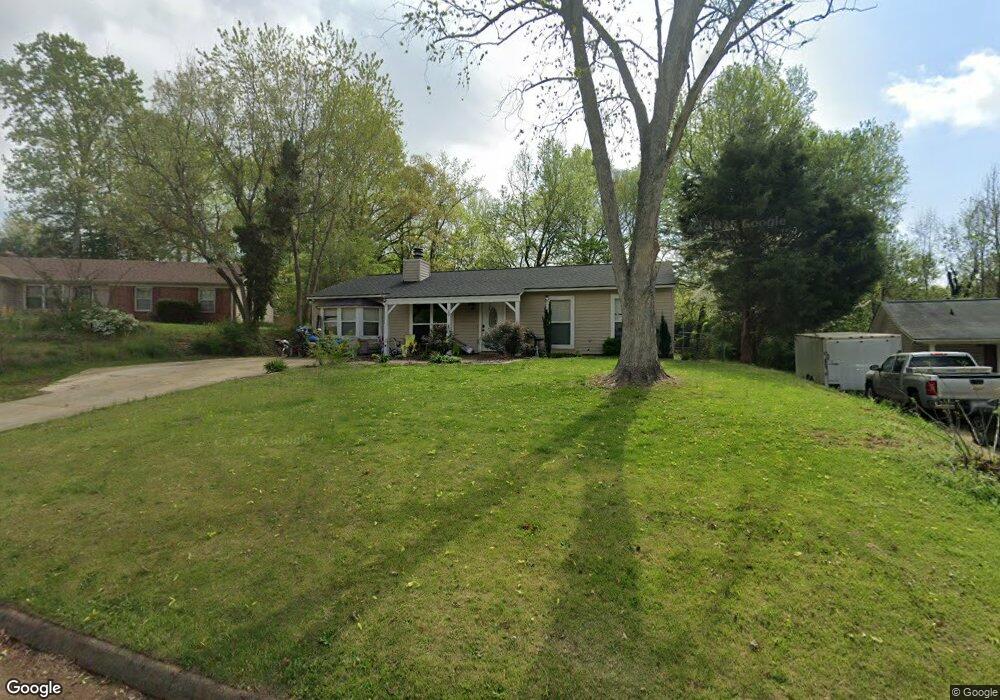
10 Carversham Row Piedmont, SC 29673
Estimated Value: $215,000 - $237,000
3
Beds
1
Bath
1,439
Sq Ft
$157/Sq Ft
Est. Value
About This Home
This home is located at 10 Carversham Row, Piedmont, SC 29673 and is currently estimated at $225,954, approximately $157 per square foot. 10 Carversham Row is a home located in Greenville County with nearby schools including Sue Cleveland Elementary School, Woodmont Middle School, and Woodmont High School.
Ownership History
Date
Name
Owned For
Owner Type
Purchase Details
Closed on
Nov 13, 2015
Sold by
Beeks Torsha Denise
Bought by
Dyal Tracy A
Current Estimated Value
Home Financials for this Owner
Home Financials are based on the most recent Mortgage that was taken out on this home.
Original Mortgage
$95,629
Outstanding Balance
$75,471
Interest Rate
3.89%
Mortgage Type
New Conventional
Estimated Equity
$150,483
Purchase Details
Closed on
Apr 23, 2015
Sold by
Mcm Capital Partners Llc
Bought by
Beeks Torsha Denise
Purchase Details
Closed on
Aug 15, 2007
Sold by
Edge Dawn Christina and Cash Dawn Christina
Bought by
Ginn Jeremy M and Ginn Heather N
Home Financials for this Owner
Home Financials are based on the most recent Mortgage that was taken out on this home.
Original Mortgage
$92,500
Interest Rate
6.56%
Mortgage Type
Purchase Money Mortgage
Purchase Details
Closed on
Mar 12, 2002
Sold by
Edge Casey
Bought by
Edge Dawn Christina
Purchase Details
Closed on
Dec 8, 1998
Sold by
Harris Monty W
Bought by
Edge Dawn C
Create a Home Valuation Report for This Property
The Home Valuation Report is an in-depth analysis detailing your home's value as well as a comparison with similar homes in the area
Home Values in the Area
Average Home Value in this Area
Purchase History
| Date | Buyer | Sale Price | Title Company |
|---|---|---|---|
| Dyal Tracy A | $93,000 | None Available | |
| Beeks Torsha Denise | $45,000 | -- | |
| Ginn Jeremy M | $92,500 | Attorney | |
| Edge Dawn Christina | -- | -- | |
| Edge Dawn C | $77,900 | -- |
Source: Public Records
Mortgage History
| Date | Status | Borrower | Loan Amount |
|---|---|---|---|
| Open | Dyal Tracy A | $95,629 | |
| Previous Owner | Ginn Jeremy M | $92,500 |
Source: Public Records
Tax History Compared to Growth
Tax History
| Year | Tax Paid | Tax Assessment Tax Assessment Total Assessment is a certain percentage of the fair market value that is determined by local assessors to be the total taxable value of land and additions on the property. | Land | Improvement |
|---|---|---|---|---|
| 2024 | $812 | $4,100 | $740 | $3,360 |
| 2023 | $812 | $4,100 | $740 | $3,360 |
| 2022 | $777 | $4,100 | $740 | $3,360 |
| 2021 | $767 | $4,100 | $740 | $3,360 |
| 2020 | $734 | $3,660 | $640 | $3,020 |
| 2019 | $734 | $3,660 | $640 | $3,020 |
| 2018 | $783 | $3,660 | $640 | $3,020 |
| 2017 | $783 | $3,660 | $640 | $3,020 |
| 2016 | $746 | $91,550 | $16,000 | $75,550 |
| 2015 | $1,596 | $78,810 | $16,000 | $62,810 |
| 2014 | $1,726 | $87,870 | $16,000 | $71,870 |
Source: Public Records
Map
Nearby Homes
- 5 Carversham Row
- 732 Streamside Dr
- 208 Furr Rd
- 772 Piedmont Hwy
- 200 Jacqueline Rd
- 200 Jacqueline Rd Unit Lot 37
- 24 Criss Dr
- 24 Criss Dr Unit Lot 102
- 311AA Shirley Rd
- 206 Jacqueline Rd
- 17 Griss Dr
- 17 Griss Dr Unit Lot 105
- 5 Wisteria Ln
- 208 Moody Rd
- 402 Jacqueline Rd
- 104 Kernow Ln
- 112 Kernow Ln
- Harris Plan at South Park
- Denver Plan at South Park
- MacGregor I Plan at South Park
- 11 Carversham Row
- 9 Carversham Row
- 12 Carversham Row
- 6 Charlwood Ave
- 4 Charlwood Ave
- 23 Cooperfield Ave
- 8 Charlwood Ave
- 8 Carversham Row
- 13 Carversham Row
- 21 Cooperfield Ave
- 4 Carversham Row
- 10 Charlwood Ave
- 6 Carversham Row
- 7 Carversham Row
- 27 Cooperfield Ave
- 3 Carversham Row
- 22 Charlwood Ave
- 14 Carversham Row
- 24 Charlwood Ave