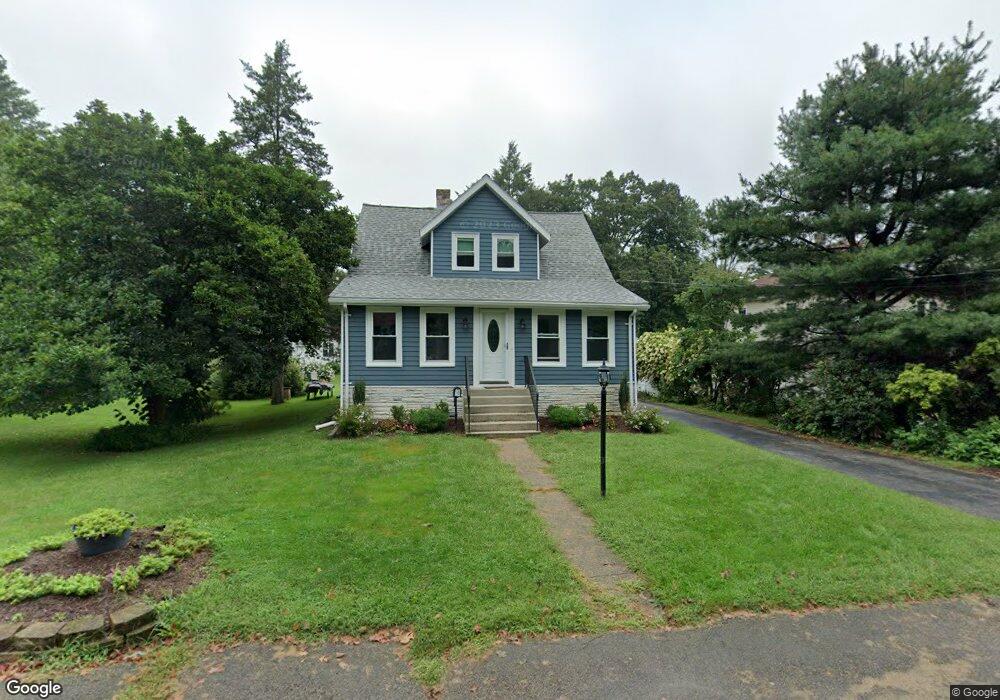
10 Cassidy Ln Medway, MA 02053
Estimated Value: $457,000 - $563,204
3
Beds
2
Baths
1,155
Sq Ft
$454/Sq Ft
Est. Value
About This Home
This home is located at 10 Cassidy Ln, Medway, MA 02053 and is currently estimated at $524,051, approximately $453 per square foot. 10 Cassidy Ln is a home located in Norfolk County with nearby schools including John D. McGovern Elementary School, Burke-Memorial Elementary, and Medway Middle School.
Ownership History
Date
Name
Owned For
Owner Type
Purchase Details
Closed on
Oct 4, 2000
Sold by
Beksha Francis W and Beksha Michael W
Bought by
Johnson Walter R and Johnson Lisa J
Current Estimated Value
Home Financials for this Owner
Home Financials are based on the most recent Mortgage that was taken out on this home.
Original Mortgage
$158,500
Interest Rate
7.96%
Mortgage Type
Purchase Money Mortgage
Create a Home Valuation Report for This Property
The Home Valuation Report is an in-depth analysis detailing your home's value as well as a comparison with similar homes in the area
Home Values in the Area
Average Home Value in this Area
Purchase History
| Date | Buyer | Sale Price | Title Company |
|---|---|---|---|
| Johnson Walter R | $140,000 | -- |
Source: Public Records
Mortgage History
| Date | Status | Borrower | Loan Amount |
|---|---|---|---|
| Open | Johnson Walter R | $252,046 | |
| Closed | Johnson Walter R | $158,500 |
Source: Public Records
Tax History Compared to Growth
Tax History
| Year | Tax Paid | Tax Assessment Tax Assessment Total Assessment is a certain percentage of the fair market value that is determined by local assessors to be the total taxable value of land and additions on the property. | Land | Improvement |
|---|---|---|---|---|
| 2025 | $6,307 | $442,600 | $287,200 | $155,400 |
| 2024 | $6,373 | $442,600 | $287,200 | $155,400 |
| 2023 | $6,021 | $377,700 | $238,000 | $139,700 |
| 2022 | $5,958 | $351,900 | $211,300 | $140,600 |
| 2021 | $5,563 | $318,600 | $194,900 | $123,700 |
| 2020 | $5,465 | $312,300 | $180,500 | $131,800 |
| 2019 | $5,300 | $312,300 | $180,500 | $131,800 |
| 2018 | $5,061 | $286,600 | $155,900 | $130,700 |
| 2017 | $5,079 | $283,400 | $155,900 | $127,500 |
| 2016 | $4,806 | $265,400 | $137,900 | $127,500 |
| 2015 | $4,531 | $248,400 | $123,100 | $125,300 |
| 2014 | $4,667 | $247,700 | $131,300 | $116,400 |
Source: Public Records
Map
Nearby Homes
- 20 Broad St Unit 6
- 20 Broad St Unit A
- 20 Broad St Unit 4
- 14 Sanford St Unit 15
- 9 Sanford St
- 280 Village St Unit D2
- 841 Lincoln St
- 4 Shaw St
- 7 Gloucester Dr
- 0 Elm St
- 50 Main St
- 22 Sunset Dr
- 3 Meryl St
- 56 Fuller Place
- 2 Skyline Dr
- 106 Holliston St
- 28 Wellington St
- 12 Lovering St
- 14 Heritage Dr
- 21 Riverside Rd