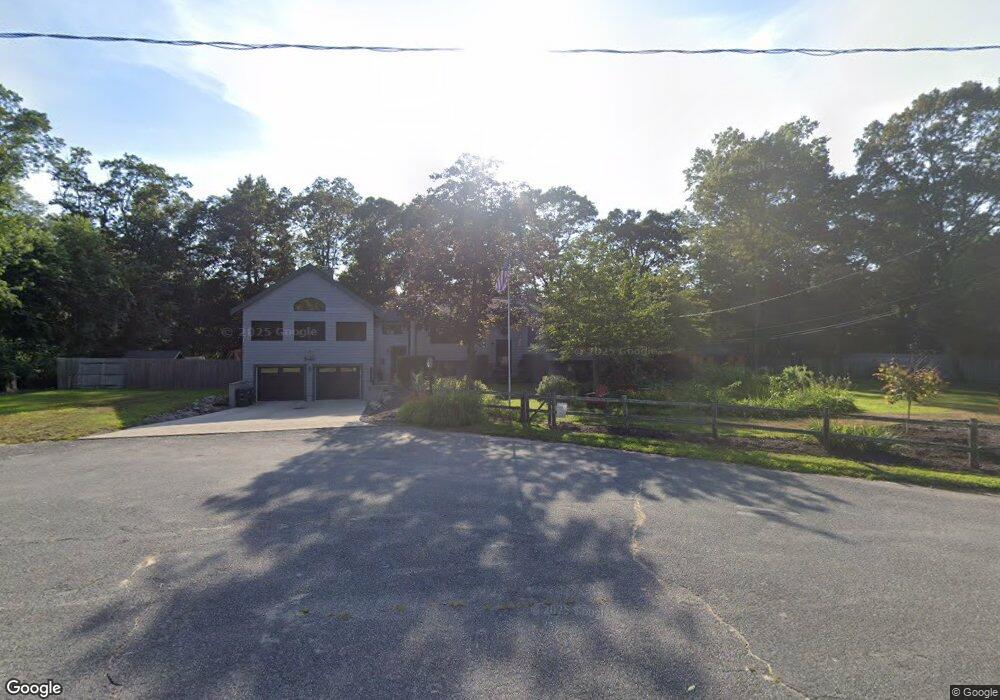
10 Cedar Hill Rd Rehoboth, MA 02769
Estimated Value: $578,000 - $659,000
3
Beds
2
Baths
1,542
Sq Ft
$400/Sq Ft
Est. Value
About This Home
This home is located at 10 Cedar Hill Rd, Rehoboth, MA 02769 and is currently estimated at $616,976, approximately $400 per square foot. 10 Cedar Hill Rd is a home located in Bristol County with nearby schools including Dighton-Rehoboth Regional High School and Grace Baptist Christian Academy.
Ownership History
Date
Name
Owned For
Owner Type
Purchase Details
Closed on
Apr 20, 2021
Sold by
Plante Gary A and Plante Tracy L
Bought by
Plante Ft
Current Estimated Value
Purchase Details
Closed on
Apr 26, 2010
Sold by
Audette Jeffrey A
Bought by
Plante Gary A and Plante Tracy L
Home Financials for this Owner
Home Financials are based on the most recent Mortgage that was taken out on this home.
Original Mortgage
$270,019
Interest Rate
5.12%
Mortgage Type
FHA
Purchase Details
Closed on
Dec 12, 2006
Sold by
Towne Tracy
Bought by
Audette Jeffrey A
Purchase Details
Closed on
Apr 13, 2005
Sold by
Audette Jeffrey A
Bought by
Audette Jeffrey A and Towne Tracy
Create a Home Valuation Report for This Property
The Home Valuation Report is an in-depth analysis detailing your home's value as well as a comparison with similar homes in the area
Home Values in the Area
Average Home Value in this Area
Purchase History
| Date | Buyer | Sale Price | Title Company |
|---|---|---|---|
| Plante Ft | -- | None Available | |
| Plante Gary A | $275,000 | -- | |
| Audette Jeffrey A | -- | -- | |
| Audette Jeffrey A | -- | -- |
Source: Public Records
Mortgage History
| Date | Status | Borrower | Loan Amount |
|---|---|---|---|
| Previous Owner | Plante Gary A | $270,019 |
Source: Public Records
Tax History
| Year | Tax Paid | Tax Assessment Tax Assessment Total Assessment is a certain percentage of the fair market value that is determined by local assessors to be the total taxable value of land and additions on the property. | Land | Improvement |
|---|---|---|---|---|
| 2025 | $55 | $493,100 | $157,500 | $335,600 |
| 2024 | $5,391 | $474,600 | $157,500 | $317,100 |
| 2023 | $4,822 | $436,900 | $154,500 | $282,400 |
| 2022 | $4,822 | $380,600 | $154,500 | $226,100 |
| 2021 | $4,731 | $357,300 | $147,000 | $210,300 |
| 2020 | $3,681 | $280,600 | $147,000 | $133,600 |
| 2018 | $3,219 | $268,900 | $140,100 | $128,800 |
| 2017 | $3,195 | $254,400 | $140,100 | $114,300 |
| 2016 | $3,130 | $257,600 | $140,100 | $117,500 |
| 2015 | $2,985 | $242,500 | $133,500 | $109,000 |
| 2014 | $2,798 | $224,900 | $127,200 | $97,700 |
Source: Public Records
Map
Nearby Homes
Your Personal Tour Guide
Ask me questions while you tour the home.