10 Charles St Lakeville, MA 02347
Estimated Value: $496,000 - $619,000
2
Beds
2
Baths
1,204
Sq Ft
$477/Sq Ft
Est. Value
About This Home
This home is located at 10 Charles St, Lakeville, MA 02347 and is currently estimated at $573,780, approximately $476 per square foot. 10 Charles St is a home located in Plymouth County with nearby schools including George R Austin Intermediate School, Assawompset Elementary School, and Freetown-Lakeville Middle School.
Ownership History
Date
Name
Owned For
Owner Type
Purchase Details
Closed on
Dec 8, 1992
Sold by
Bissonnette Donald G and Bissonnette Betty A
Bought by
Parma Joseph D and Parma Jeanne E
Current Estimated Value
Purchase Details
Closed on
Jul 7, 1992
Sold by
Hanelt Ben H and Hanelt Janet M
Bought by
Bissonnette Donald G and Bissonnette Betty
Create a Home Valuation Report for This Property
The Home Valuation Report is an in-depth analysis detailing your home's value as well as a comparison with similar homes in the area
Home Values in the Area
Average Home Value in this Area
Purchase History
| Date | Buyer | Sale Price | Title Company |
|---|---|---|---|
| Parma Joseph D | $87,500 | -- | |
| Bissonnette Donald G | $65,000 | -- |
Source: Public Records
Mortgage History
| Date | Status | Borrower | Loan Amount |
|---|---|---|---|
| Open | Bissonnette Donald G | $59,000 | |
| Closed | Bissonnette Donald G | $25,000 | |
| Closed | Bissonnette Donald G | $55,000 | |
| Open | Bissonnette Donald G | $120,000 |
Source: Public Records
Tax History Compared to Growth
Tax History
| Year | Tax Paid | Tax Assessment Tax Assessment Total Assessment is a certain percentage of the fair market value that is determined by local assessors to be the total taxable value of land and additions on the property. | Land | Improvement |
|---|---|---|---|---|
| 2025 | $6,159 | $595,100 | $378,300 | $216,800 |
| 2024 | $5,881 | $557,400 | $354,100 | $203,300 |
| 2023 | $5,539 | $496,800 | $309,300 | $187,500 |
| 2022 | $5,850 | $484,700 | $317,200 | $167,500 |
| 2021 | $5,773 | $452,100 | $298,100 | $154,000 |
| 2020 | $5,698 | $436,300 | $289,400 | $146,900 |
| 2019 | $480 | $384,400 | $248,500 | $135,900 |
| 2018 | $4,920 | $362,000 | $232,200 | $129,800 |
| 2017 | $4,244 | $306,200 | $193,500 | $112,700 |
| 2016 | $4,211 | $298,000 | $192,600 | $105,400 |
| 2015 | $4,093 | $287,200 | $184,200 | $103,000 |
Source: Public Records
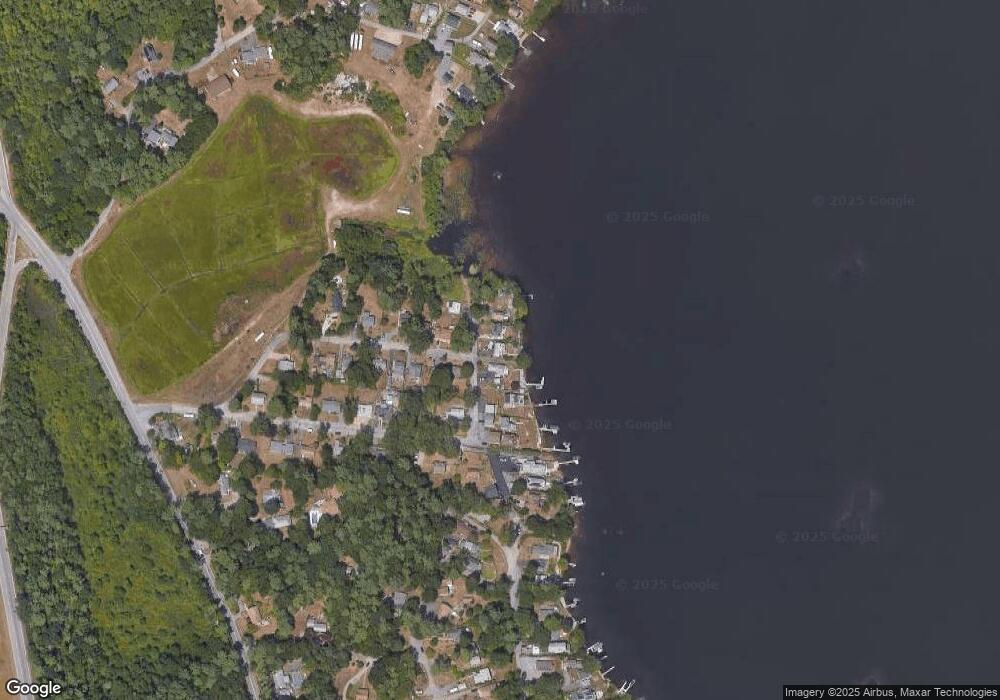
Map
Nearby Homes