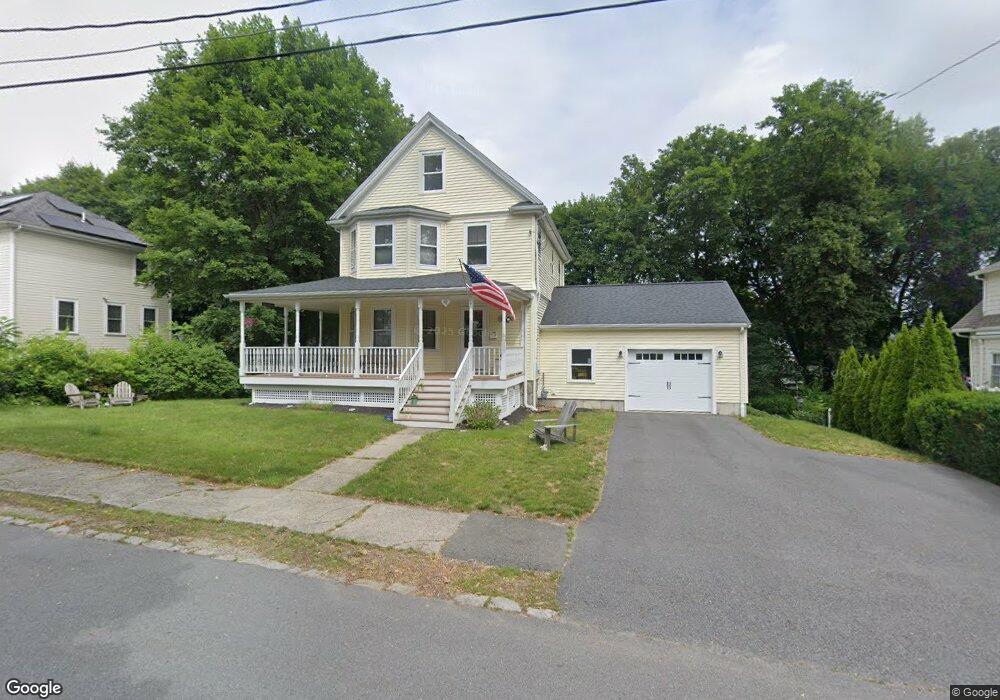
10 Charles St Walpole, MA 02081
Estimated Value: $639,000 - $692,000
3
Beds
1
Bath
1,498
Sq Ft
$446/Sq Ft
Est. Value
About This Home
This home is located at 10 Charles St, Walpole, MA 02081 and is currently estimated at $667,503, approximately $445 per square foot. 10 Charles St is a home located in Norfolk County with nearby schools including Boyden School, Eleanor N. Johnson Middle School, and Walpole High School.
Ownership History
Date
Name
Owned For
Owner Type
Purchase Details
Closed on
Dec 29, 2014
Sold by
Gallant Philip H and Gallant Beth M
Bought by
Gallant Beth M
Current Estimated Value
Purchase Details
Closed on
Oct 20, 2000
Sold by
Devine John and Devine Janet E
Bought by
Gallant Philip H and Gallant Beth M
Home Financials for this Owner
Home Financials are based on the most recent Mortgage that was taken out on this home.
Original Mortgage
$120,000
Interest Rate
7.88%
Mortgage Type
Purchase Money Mortgage
Create a Home Valuation Report for This Property
The Home Valuation Report is an in-depth analysis detailing your home's value as well as a comparison with similar homes in the area
Home Values in the Area
Average Home Value in this Area
Purchase History
| Date | Buyer | Sale Price | Title Company |
|---|---|---|---|
| Gallant Beth M | -- | -- | |
| Gallant Philip H | $201,000 | -- |
Source: Public Records
Mortgage History
| Date | Status | Borrower | Loan Amount |
|---|---|---|---|
| Previous Owner | Gallant Philip H | $120,000 |
Source: Public Records
Tax History Compared to Growth
Tax History
| Year | Tax Paid | Tax Assessment Tax Assessment Total Assessment is a certain percentage of the fair market value that is determined by local assessors to be the total taxable value of land and additions on the property. | Land | Improvement |
|---|---|---|---|---|
| 2025 | $7,731 | $602,600 | $342,200 | $260,400 |
| 2024 | $7,513 | $568,300 | $329,000 | $239,300 |
| 2023 | $7,224 | $520,100 | $286,100 | $234,000 |
| 2022 | $6,812 | $471,100 | $264,900 | $206,200 |
| 2021 | $6,484 | $436,900 | $249,900 | $187,000 |
| 2020 | $6,405 | $427,300 | $235,800 | $191,500 |
| 2019 | $6,093 | $403,500 | $226,700 | $176,800 |
| 2018 | $5,796 | $379,600 | $217,900 | $161,700 |
| 2017 | $5,603 | $365,500 | $209,500 | $156,000 |
| 2016 | $5,135 | $330,000 | $201,400 | $128,600 |
| 2015 | $4,967 | $316,400 | $191,400 | $125,000 |
| 2014 | $4,799 | $304,500 | $191,400 | $113,100 |
Source: Public Records
Map
Nearby Homes
- 103 Centre Ln
- 305 Centre Ln
- 224 School St Unit 10
- 145 South St Unit 5
- 145 South St Unit 19
- 8 Autumn Ln
- 66 Oak St
- 8 Rainbow Pond Dr Unit 8
- 1156 Washington St
- 4403 Pennington Dr Unit 4403
- 18 Teal Cir
- 24 Pelican Dr
- 1391 Main St Unit 304
- 1391 Main St Unit 208
- 1391 Main St Unit 305
- 1391 Main St Unit 308
- 52 Baker St
- 127 Clear Pond Dr
- 137 Clear Pond Dr
- 16 Magpie Cir Unit 16