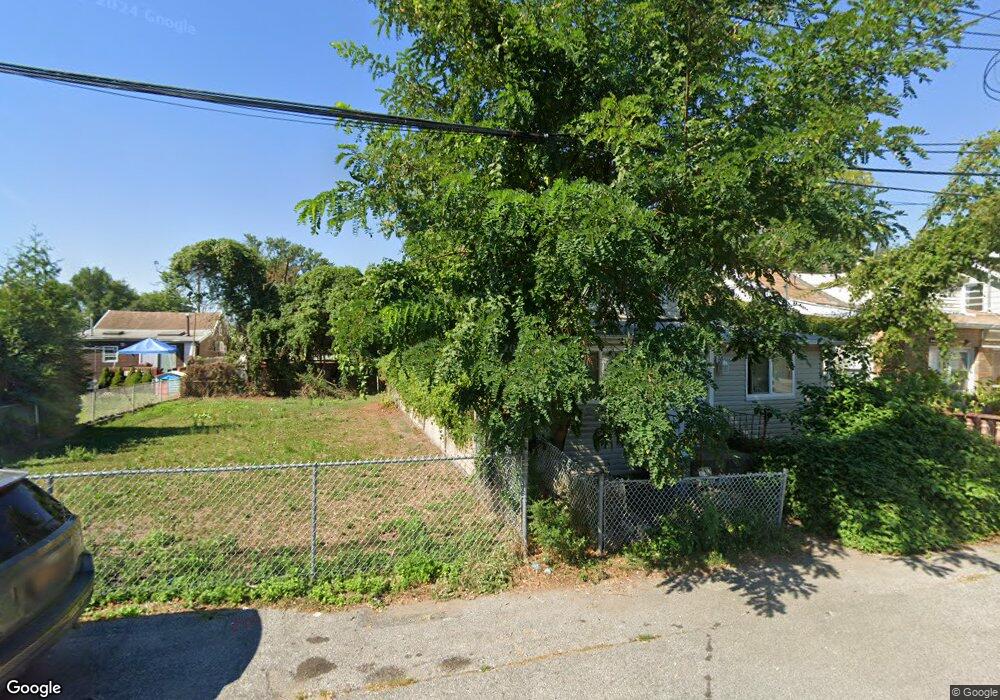
10 Cherokee St Staten Island, NY 10305
Midland Beach NeighborhoodEstimated Value: $25,871 - $528,000
3
Beds
1
Bath
1,050
Sq Ft
$208/Sq Ft
Est. Value
About This Home
This home is located at 10 Cherokee St, Staten Island, NY 10305 and is currently estimated at $218,468, approximately $208 per square foot. 10 Cherokee St is a home located in Richmond County with nearby schools including P.S. 052 John C. Thompson, Is 2 George L Egbert, and New Dorp High School.
Ownership History
Date
Name
Owned For
Owner Type
Purchase Details
Closed on
Dec 16, 2019
Sold by
Esl11 Properties Llc
Bought by
Esl3 Properties Llc
Current Estimated Value
Purchase Details
Closed on
Nov 25, 2019
Sold by
Housing Trust Fund Corporation
Bought by
Esl 11 Properties Llc
Purchase Details
Closed on
Apr 16, 2015
Sold by
Hudgens Catherine
Bought by
Housing Trust Fund Corporation
Purchase Details
Closed on
Nov 21, 2001
Sold by
Hudgens David
Bought by
Hudgens Catherine
Purchase Details
Closed on
Dec 28, 1995
Sold by
Monahan Christopher T and Taverna Diane L
Bought by
Hudgens David and Hudgens Catherine
Home Financials for this Owner
Home Financials are based on the most recent Mortgage that was taken out on this home.
Original Mortgage
$102,600
Interest Rate
7.16%
Create a Home Valuation Report for This Property
The Home Valuation Report is an in-depth analysis detailing your home's value as well as a comparison with similar homes in the area
Home Values in the Area
Average Home Value in this Area
Purchase History
| Date | Buyer | Sale Price | Title Company |
|---|---|---|---|
| Esl3 Properties Llc | -- | Chelsea Title Agency Llc | |
| Esl 11 Properties Llc | $20,000 | Chelsea Title Agency Llc | |
| Housing Trust Fund Corporation | -- | Fidelity Natl Title Ins Co | |
| Hudgens Catherine | $30,000 | -- | |
| Hudgens David | $108,000 | Chicago Title Insurance Co |
Source: Public Records
Mortgage History
| Date | Status | Borrower | Loan Amount |
|---|---|---|---|
| Previous Owner | Hudgens David | $102,600 |
Source: Public Records
Tax History Compared to Growth
Tax History
| Year | Tax Paid | Tax Assessment Tax Assessment Total Assessment is a certain percentage of the fair market value that is determined by local assessors to be the total taxable value of land and additions on the property. | Land | Improvement |
|---|---|---|---|---|
| 2025 | $810 | $5,280 | $4,274 | $1,006 |
| 2024 | $810 | $4,320 | $4,032 | $288 |
| 2023 | $790 | $3,888 | $3,888 | $0 |
| 2022 | $776 | $4,080 | $4,080 | $0 |
| 2021 | $795 | $4,140 | $4,140 | $0 |
| 2020 | $754 | $3,840 | $3,840 | $0 |
| 2019 | $0 | $3,360 | $3,360 | $0 |
| 2018 | $660 | $3,240 | $3,240 | $0 |
| 2017 | $0 | $3,300 | $3,240 | $60 |
| 2016 | -- | $3,300 | $3,240 | $60 |
| 2015 | $1,586 | $10,399 | $3,954 | $6,445 |
| 2014 | $1,586 | $9,852 | $3,746 | $6,106 |
Source: Public Records
Map
Nearby Homes
- 9 Iroquois St
- 799 Father Capodanno Blvd
- 797 Father Capodanno Blvd
- 795 Father Capodanno Blvd
- 929 Father Capodanno Blvd
- 00 Baden Place
- 0 Baden Place Unit 2503276
- 665 Hunter Ave
- 568 Dongan Hills Ave Unit 19A1
- 107 Baden Place
- 114 Baden Place
- 188 Graham Blvd Unit B
- 107 Mapleton Ave
- 952 Olympia Blvd
- 118 Baden Place
- 1031 Father Capodanno Blvd
- 763 Patterson Ave
- 431 Patterson Ave
- 498 Dongan Hills Ave
- 23 Peggy Ln