10 Chipman Ln Stoughton, MA 02072
Estimated Value: $762,944 - $890,000
4
Beds
3
Baths
2,204
Sq Ft
$371/Sq Ft
Est. Value
About This Home
This home is located at 10 Chipman Ln, Stoughton, MA 02072 and is currently estimated at $817,986, approximately $371 per square foot. 10 Chipman Ln is a home located in Norfolk County with nearby schools including Joseph H. Gibbons Elementary School, Dr. Robert G. O'Donnell Middle School, and Stoughton High School.
Ownership History
Date
Name
Owned For
Owner Type
Purchase Details
Closed on
Dec 5, 2022
Sold by
Schertzer Steven and Schertzer Laurie
Bought by
Schertzer Ft and Schertzer
Current Estimated Value
Create a Home Valuation Report for This Property
The Home Valuation Report is an in-depth analysis detailing your home's value as well as a comparison with similar homes in the area
Home Values in the Area
Average Home Value in this Area
Purchase History
| Date | Buyer | Sale Price | Title Company |
|---|---|---|---|
| Schertzer Ft | -- | None Available | |
| Schertzer Ft | -- | None Available | |
| Schertzer Ft | -- | None Available |
Source: Public Records
Tax History Compared to Growth
Tax History
| Year | Tax Paid | Tax Assessment Tax Assessment Total Assessment is a certain percentage of the fair market value that is determined by local assessors to be the total taxable value of land and additions on the property. | Land | Improvement |
|---|---|---|---|---|
| 2025 | $8,688 | $701,800 | $250,700 | $451,100 |
| 2024 | $8,585 | $674,400 | $239,400 | $435,000 |
| 2023 | $8,268 | $610,200 | $205,200 | $405,000 |
| 2022 | $7,770 | $539,200 | $178,600 | $360,600 |
| 2021 | $7,698 | $509,800 | $171,000 | $338,800 |
| 2020 | $7,484 | $502,600 | $171,000 | $331,600 |
| 2019 | $7,290 | $475,200 | $171,000 | $304,200 |
| 2018 | $6,699 | $452,300 | $174,800 | $277,500 |
| 2017 | $6,484 | $447,500 | $174,800 | $272,700 |
| 2016 | $6,434 | $429,800 | $171,000 | $258,800 |
| 2015 | $6,417 | $424,100 | $165,300 | $258,800 |
| 2014 | $6,181 | $392,700 | $144,400 | $248,300 |
Source: Public Records
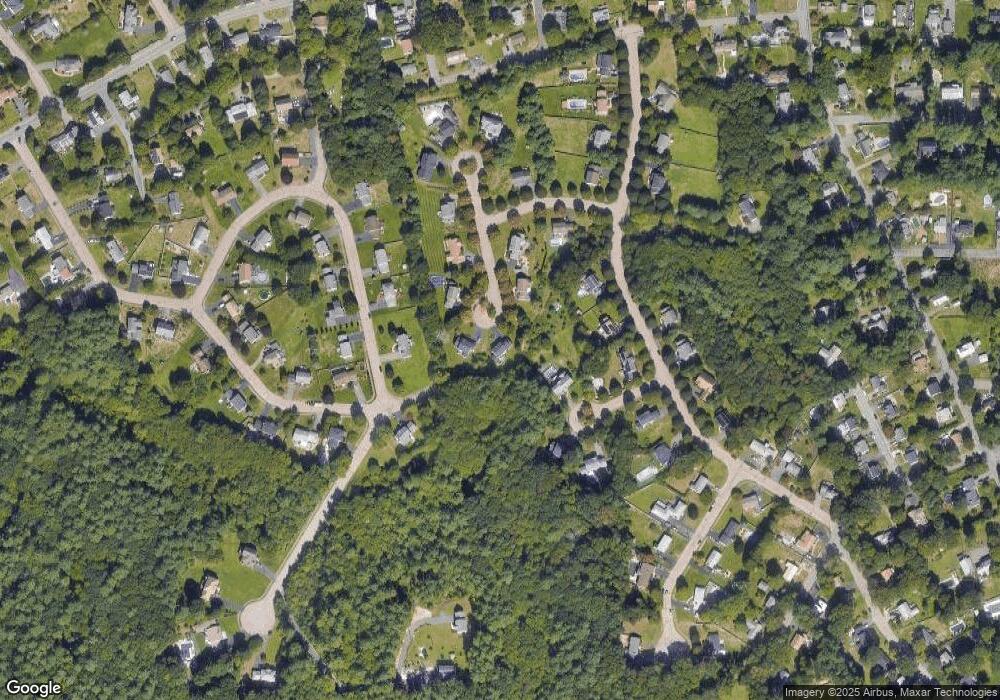
Map
Nearby Homes
- 12 Chipman Ln
- 8 Chipman Ln
- 11 Gary Guest Cir
- 14 Chipman Ln
- 45 Whitten Ave
- 47 Whitten Ave
- 160 Jamie Ln
- 6 Chipman Ln
- 33 Whitten Ave
- 9 Gary Guest Cir
- 16 Chipman Ln
- 120 Jamie Ln
- 18A Jeffrey Way
- 5 Gary Guest Cir
- 7 Gary Guest Cir
- 110 Jamie Ln
- 4 Robert Scott Way
- 10 Jeffrey Way
- 18 Chipman Ln
- 15A Jeffrey Way