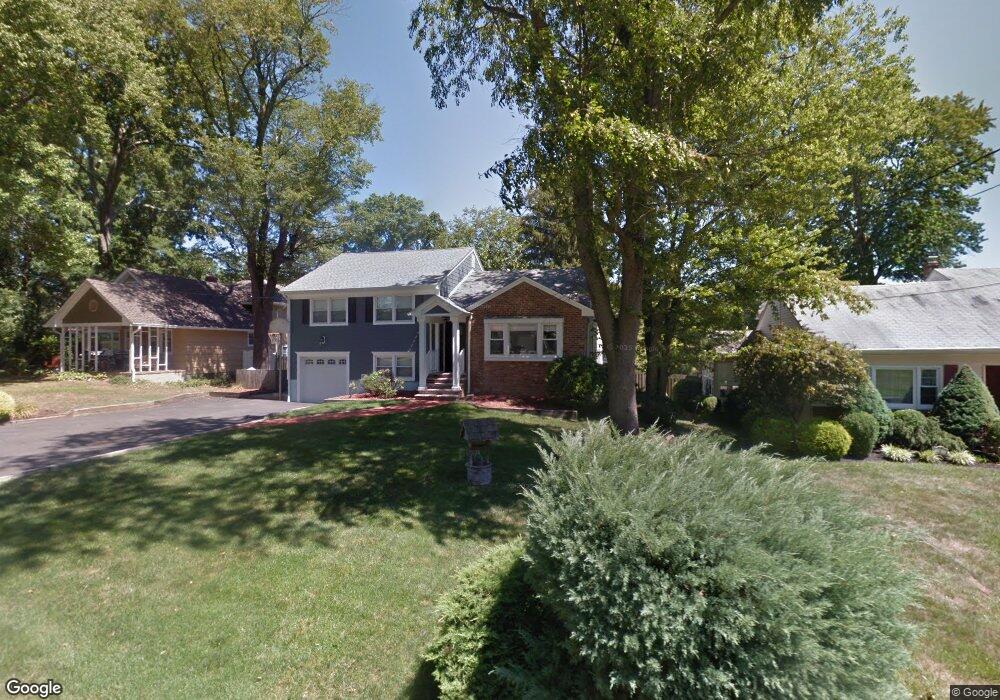
10 Chippawa Way Cranford, NJ 07016
Estimated Value: $687,000 - $1,014,000
--
Bed
--
Bath
1,840
Sq Ft
$471/Sq Ft
Est. Value
About This Home
This home is located at 10 Chippawa Way, Cranford, NJ 07016 and is currently estimated at $866,742, approximately $471 per square foot. 10 Chippawa Way is a home located in Union County with nearby schools including Cranford Sr High School and St Michael School.
Ownership History
Date
Name
Owned For
Owner Type
Purchase Details
Closed on
Dec 15, 2004
Sold by
Dillon John
Bought by
Noll Stephen and Noll Annette
Current Estimated Value
Home Financials for this Owner
Home Financials are based on the most recent Mortgage that was taken out on this home.
Original Mortgage
$438,400
Outstanding Balance
$212,502
Interest Rate
5.25%
Mortgage Type
Adjustable Rate Mortgage/ARM
Estimated Equity
$654,240
Purchase Details
Closed on
Dec 12, 1996
Sold by
Taglialavore Leonard A and Taglialavore Betty R
Bought by
Dillon John M and Dillon Concetta Lucia
Home Financials for this Owner
Home Financials are based on the most recent Mortgage that was taken out on this home.
Original Mortgage
$205,900
Interest Rate
7.62%
Create a Home Valuation Report for This Property
The Home Valuation Report is an in-depth analysis detailing your home's value as well as a comparison with similar homes in the area
Home Values in the Area
Average Home Value in this Area
Purchase History
| Date | Buyer | Sale Price | Title Company |
|---|---|---|---|
| Noll Stephen | $548,000 | -- | |
| Dillon John M | $234,000 | -- |
Source: Public Records
Mortgage History
| Date | Status | Borrower | Loan Amount |
|---|---|---|---|
| Open | Noll Stephen | $438,400 | |
| Previous Owner | Dillon John M | $205,900 |
Source: Public Records
Tax History Compared to Growth
Tax History
| Year | Tax Paid | Tax Assessment Tax Assessment Total Assessment is a certain percentage of the fair market value that is determined by local assessors to be the total taxable value of land and additions on the property. | Land | Improvement |
|---|---|---|---|---|
| 2025 | $17,158 | $253,100 | $93,300 | $159,800 |
| 2024 | $16,874 | $253,100 | $93,300 | $159,800 |
| 2023 | $16,874 | $253,100 | $93,300 | $159,800 |
| 2022 | $16,735 | $253,100 | $93,300 | $159,800 |
| 2021 | $16,662 | $253,100 | $93,300 | $159,800 |
| 2020 | $16,608 | $253,100 | $93,300 | $159,800 |
| 2019 | $16,502 | $253,100 | $93,300 | $159,800 |
| 2018 | $16,203 | $253,100 | $93,300 | $159,800 |
| 2017 | $15,647 | $253,100 | $93,300 | $159,800 |
| 2016 | $12,397 | $208,100 | $93,300 | $114,800 |
| 2015 | $12,072 | $208,100 | $93,300 | $114,800 |
| 2014 | $11,824 | $208,100 | $93,300 | $114,800 |
Source: Public Records
Map
Nearby Homes