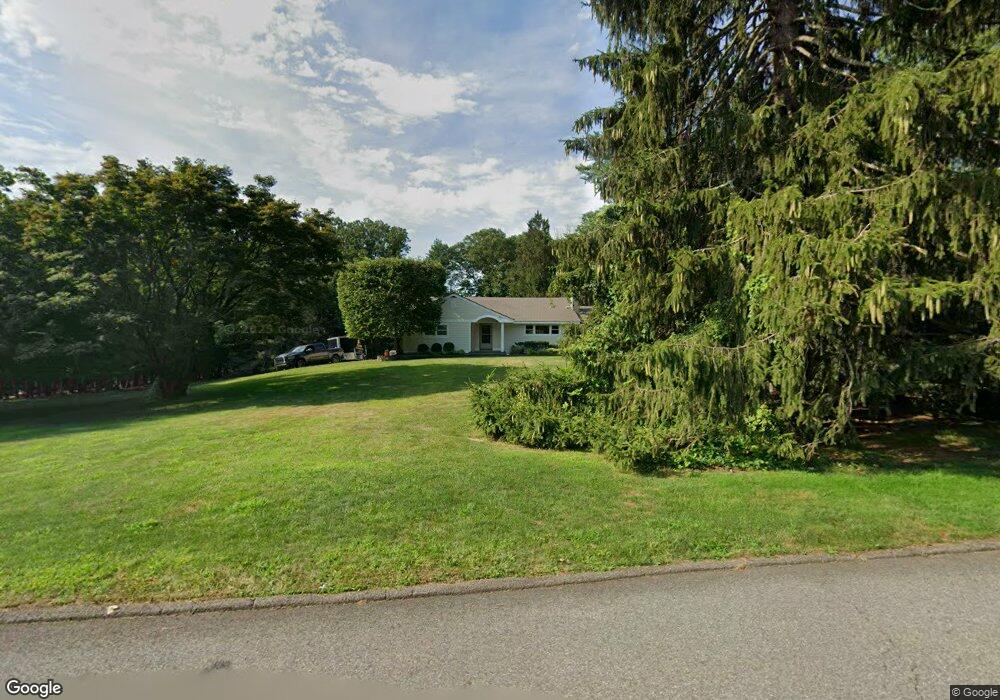
10 Christopher Place Saddle River, NJ 07458
Estimated Value: $1,271,083 - $1,494,000
--
Bed
--
Bath
1,903
Sq Ft
$740/Sq Ft
Est. Value
About This Home
This home is located at 10 Christopher Place, Saddle River, NJ 07458 and is currently estimated at $1,407,694, approximately $739 per square foot. 10 Christopher Place is a home located in Bergen County with nearby schools including Wandell Elementary School, Saddle River Day School, and Waldwick Seventh-Day Adventist School.
Ownership History
Date
Name
Owned For
Owner Type
Purchase Details
Closed on
Sep 10, 2014
Sold by
Inserra John and Inserra Jack
Bought by
Inserra John
Current Estimated Value
Home Financials for this Owner
Home Financials are based on the most recent Mortgage that was taken out on this home.
Original Mortgage
$421,686
Interest Rate
3.2%
Mortgage Type
New Conventional
Purchase Details
Closed on
Aug 20, 1999
Sold by
Wolfe Richard A and Wolfe Irene M
Bought by
Inserra Jack
Home Financials for this Owner
Home Financials are based on the most recent Mortgage that was taken out on this home.
Original Mortgage
$300,000
Interest Rate
7%
Mortgage Type
Stand Alone First
Create a Home Valuation Report for This Property
The Home Valuation Report is an in-depth analysis detailing your home's value as well as a comparison with similar homes in the area
Home Values in the Area
Average Home Value in this Area
Purchase History
| Date | Buyer | Sale Price | Title Company |
|---|---|---|---|
| Inserra John | -- | None Available | |
| Inserra Jack | $620,000 | Lawyers Title Insurance Corp |
Source: Public Records
Mortgage History
| Date | Status | Borrower | Loan Amount |
|---|---|---|---|
| Previous Owner | Inserra John | $421,686 | |
| Previous Owner | Inserra Jack | $300,000 |
Source: Public Records
Tax History Compared to Growth
Tax History
| Year | Tax Paid | Tax Assessment Tax Assessment Total Assessment is a certain percentage of the fair market value that is determined by local assessors to be the total taxable value of land and additions on the property. | Land | Improvement |
|---|---|---|---|---|
| 2025 | $10,328 | $996,900 | $756,500 | $240,400 |
| 2024 | $10,178 | $996,900 | $756,500 | $240,400 |
| 2023 | $9,909 | $996,900 | $756,500 | $240,400 |
| 2022 | $9,909 | $996,900 | $756,500 | $240,400 |
| 2021 | $9,819 | $996,900 | $756,500 | $240,400 |
| 2020 | $9,560 | $996,900 | $756,500 | $240,400 |
| 2019 | $9,181 | $996,900 | $756,500 | $240,400 |
| 2018 | $9,032 | $996,900 | $756,500 | $240,400 |
| 2017 | $9,213 | $909,500 | $751,500 | $158,000 |
| 2016 | $9,268 | $909,500 | $751,500 | $158,000 |
| 2015 | $8,977 | $909,500 | $751,500 | $158,000 |
| 2014 | $8,886 | $909,500 | $751,500 | $158,000 |
Source: Public Records
Map
Nearby Homes
- 123 E Saddle River Rd
- 6 Adams Rd
- 6 Burning Hollow Rd
- 98 E Saddle River Rd
- 154 E Saddle River Rd
- 5 Burning Hollow Rd
- 136 Waldwick Ave
- 15 N Church Rd
- 19 Powder Hill Rd
- 10 E Allendale Rd
- 2 Alford Dr
- 186 E Saddle River Rd
- 130 Manhattan Ave
- 90 Arcadia Rd
- 356 E Allendale Ave
- 66 Waldwick Ave
- 34 Nordham St
- 92 Grove St
- 46 Lincoln Place
- 34 Summit Ave
- 14 Christopher Place
- 6 Christopher Place
- 11 Christopher Place
- 7 Christopher Place
- 11 Spruce Rd
- 18 Christopher Place
- 15 Spruce Rd
- 5 Spruce Rd
- 15 Christopher Place
- 3 Christopher Place
- 25 Overlook Rd
- 2 Christopher Place
- 1 Spruce Rd
- 10 Spruce Rd
- 10 Spruce Rd
- 17 Christopher Place
- 107 W Saddle River Rd
- 101 W Saddle River Rd
- 88 W Saddle River Rd
- 28 Overlook Rd