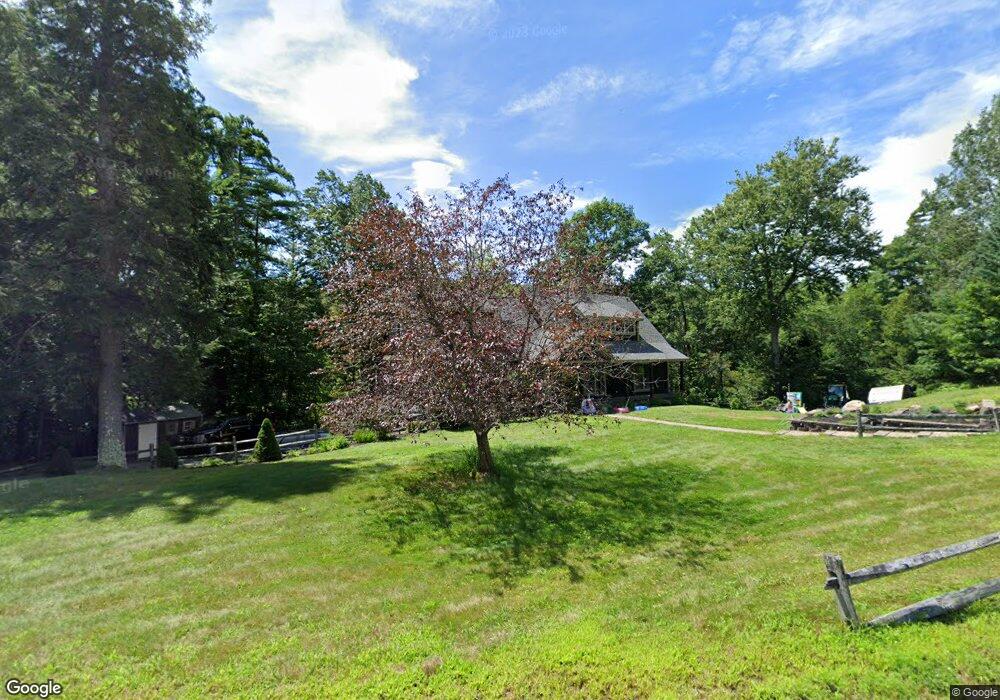
10 Cider Hill Sanford, ME 04083
Estimated Value: $642,000 - $759,000
3
Beds
2
Baths
2,564
Sq Ft
$277/Sq Ft
Est. Value
About This Home
This home is located at 10 Cider Hill, Sanford, ME 04083 and is currently estimated at $709,332, approximately $276 per square foot. 10 Cider Hill is a home located in York County.
Ownership History
Date
Name
Owned For
Owner Type
Purchase Details
Closed on
Aug 12, 2024
Sold by
Sevigny Kevin D
Bought by
Hassell Kurt J and Warren Pamela J
Current Estimated Value
Purchase Details
Closed on
Sep 2, 2009
Sold by
Us Bank Na Tr
Bought by
Sevigny Kevin D
Home Financials for this Owner
Home Financials are based on the most recent Mortgage that was taken out on this home.
Original Mortgage
$221,906
Interest Rate
5.21%
Mortgage Type
FHA
Purchase Details
Closed on
Apr 18, 2006
Sold by
Buck Jonathan E
Bought by
Gilmartin Eugene R
Home Financials for this Owner
Home Financials are based on the most recent Mortgage that was taken out on this home.
Original Mortgage
$72,000
Interest Rate
6.28%
Mortgage Type
FHA
Create a Home Valuation Report for This Property
The Home Valuation Report is an in-depth analysis detailing your home's value as well as a comparison with similar homes in the area
Home Values in the Area
Average Home Value in this Area
Purchase History
| Date | Buyer | Sale Price | Title Company |
|---|---|---|---|
| Hassell Kurt J | $725,000 | None Available | |
| Hassell Kurt J | $725,000 | None Available | |
| Sevigny Kevin D | -- | -- | |
| Gilmartin Eugene R | -- | -- | |
| Gilmartin Eugene R | -- | -- | |
| Gilmartin Eugene R | -- | -- |
Source: Public Records
Mortgage History
| Date | Status | Borrower | Loan Amount |
|---|---|---|---|
| Previous Owner | Gilmartin Eugene R | $221,906 | |
| Previous Owner | Gilmartin Eugene R | $72,000 |
Source: Public Records
Tax History Compared to Growth
Tax History
| Year | Tax Paid | Tax Assessment Tax Assessment Total Assessment is a certain percentage of the fair market value that is determined by local assessors to be the total taxable value of land and additions on the property. | Land | Improvement |
|---|---|---|---|---|
| 2025 | $7,076 | $413,800 | $63,300 | $350,500 |
| 2024 | $6,679 | $413,800 | $63,300 | $350,500 |
| 2023 | $6,212 | $410,300 | $63,300 | $347,000 |
| 2022 | $6,072 | $410,300 | $63,300 | $347,000 |
| 2021 | $6,052 | $332,900 | $63,300 | $269,600 |
| 2020 | $5,782 | $286,800 | $63,300 | $223,500 |
| 2019 | $5,546 | $267,900 | $63,300 | $204,600 |
| 2018 | $5,332 | $260,100 | $58,600 | $201,500 |
| 2017 | $5,125 | $247,100 | $58,600 | $188,500 |
| 2016 | $5,257 | $231,200 | $58,400 | $172,800 |
| 2015 | $5,228 | $247,200 | $70,000 | $177,200 |
| 2014 | $5,236 | $250,100 | $72,900 | $177,200 |
| 2013 | -- | $252,200 | $72,900 | $179,300 |
Source: Public Records
Map
Nearby Homes
- 10 Cider Hill Rd
- 12 Cider Hill Rd
- 7 Cider Hill Rd
- 9 Cider Hill
- 9 Cider Hill Rd
- 5 Cider Hill Rd
- 6 Cider Hill Rd
- 3 Cider Hill Rd
- 62 Stanley Rd
- 10 Fairoaks Dr
- 52 Stanley Rd
- 104 Stanley Rd
- 8 Fairoaks Dr
- 6 Fairoaks Dr
- R2 73A Fairoaks Dr
- 9 Fairoaks Dr
- 11 Fairoaks Dr
- 97 Stanley Rd
- 7 Fairoaks Dr
- 4 Fairoaks Dr