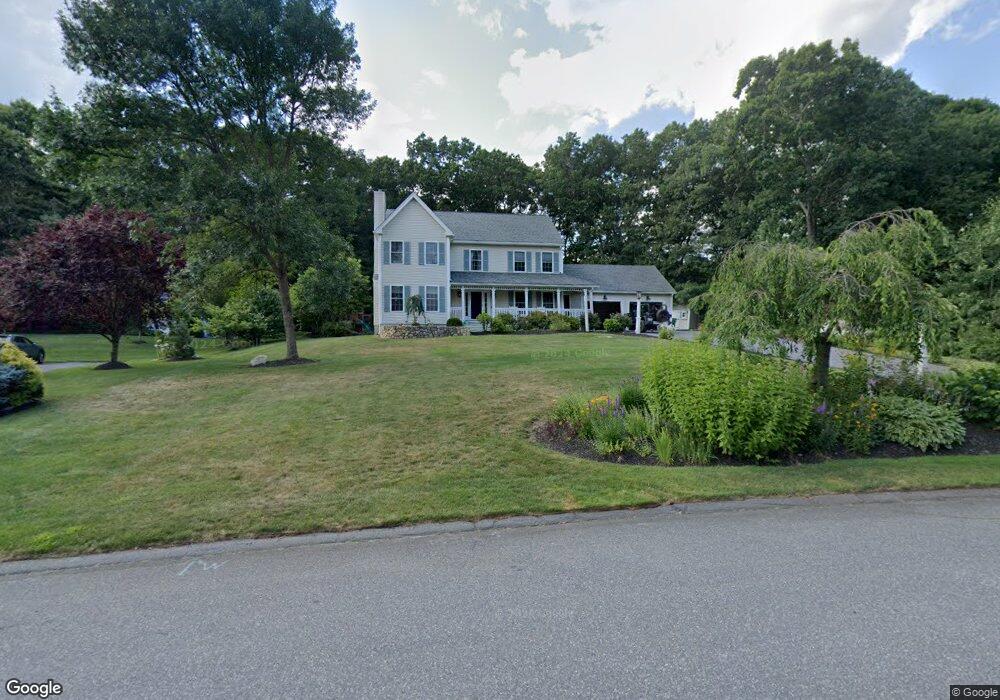
10 Coburn Dr Ashland, MA 01721
Estimated Value: $1,024,000 - $1,253,000
4
Beds
3
Baths
3,210
Sq Ft
$347/Sq Ft
Est. Value
About This Home
This home is located at 10 Coburn Dr, Ashland, MA 01721 and is currently estimated at $1,113,306, approximately $346 per square foot. 10 Coburn Dr is a home located in Middlesex County with nearby schools including William Pittaway Elementary School, David Mindess Elementary School, and Henry E. Warren Elementary School.
Ownership History
Date
Name
Owned For
Owner Type
Purchase Details
Closed on
Jun 22, 2020
Sold by
Uliss Amy
Bought by
Medernach Ian J and Medernach Caitlin E
Current Estimated Value
Home Financials for this Owner
Home Financials are based on the most recent Mortgage that was taken out on this home.
Original Mortgage
$455,000
Outstanding Balance
$403,323
Interest Rate
3.2%
Mortgage Type
New Conventional
Estimated Equity
$709,983
Purchase Details
Closed on
Oct 30, 1998
Sold by
Oak View Llc
Bought by
Uliss Steven A and Uliss Amy D
Home Financials for this Owner
Home Financials are based on the most recent Mortgage that was taken out on this home.
Original Mortgage
$259,920
Interest Rate
6.68%
Mortgage Type
Purchase Money Mortgage
Create a Home Valuation Report for This Property
The Home Valuation Report is an in-depth analysis detailing your home's value as well as a comparison with similar homes in the area
Home Values in the Area
Average Home Value in this Area
Purchase History
| Date | Buyer | Sale Price | Title Company |
|---|---|---|---|
| Medernach Ian J | $710,000 | None Available | |
| Uliss Steven A | $324,900 | -- |
Source: Public Records
Mortgage History
| Date | Status | Borrower | Loan Amount |
|---|---|---|---|
| Open | Medernach Ian J | $455,000 | |
| Previous Owner | Uliss Steven A | $320,000 | |
| Previous Owner | Uliss Steven A | $259,920 | |
| Previous Owner | Uliss Steven A | $300,000 |
Source: Public Records
Tax History Compared to Growth
Tax History
| Year | Tax Paid | Tax Assessment Tax Assessment Total Assessment is a certain percentage of the fair market value that is determined by local assessors to be the total taxable value of land and additions on the property. | Land | Improvement |
|---|---|---|---|---|
| 2025 | $12,930 | $1,012,500 | $294,100 | $718,400 |
| 2024 | $12,093 | $913,400 | $294,100 | $619,300 |
| 2023 | $11,048 | $802,300 | $280,600 | $521,700 |
| 2022 | $11,011 | $693,400 | $255,000 | $438,400 |
| 2021 | $10,531 | $661,100 | $255,000 | $406,100 |
| 2020 | $10,315 | $638,300 | $255,000 | $383,300 |
| 2019 | $8,062 | $625,000 | $255,000 | $370,000 |
| 2018 | $9,542 | $574,500 | $252,800 | $321,700 |
| 2017 | $9,360 | $560,500 | $252,800 | $307,700 |
| 2016 | $9,151 | $538,300 | $252,800 | $285,500 |
| 2015 | $9,022 | $521,500 | $238,700 | $282,800 |
| 2014 | $9,055 | $520,700 | $222,800 | $297,900 |
Source: Public Records
Map
Nearby Homes
- 22 Irene Cir
- 23 Teller Dr
- 0 Cordaville Rd
- 0 Oak St
- 3 Johnson St
- 2 High Ridge Rd
- 9 Wentworth Dr
- 41 Darlene Dr
- 23 Stonebrook Ct Unit 11
- 39 Woodbury Rd
- 9 Oregon Rd
- 265 Pleasant St
- 12 Braeburn Ln
- 8 Pilgrim Rd
- 20 Braeburn Ln
- 0 Cross St
- 2 Aikens Rd
- 203 Pleasant St
- 34 Waterville Ln Unit 34
- 36 Waterville Ln Unit 36