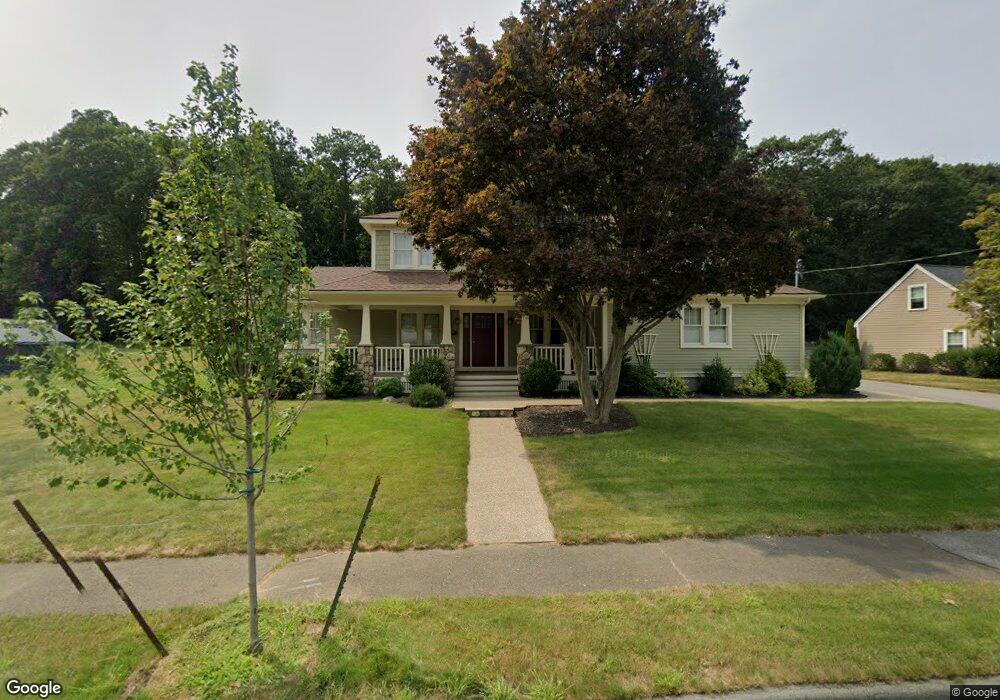
10 Colby Rd Danvers, MA 01923
Estimated Value: $831,424 - $981,000
3
Beds
3
Baths
3,116
Sq Ft
$289/Sq Ft
Est. Value
About This Home
This home is located at 10 Colby Rd, Danvers, MA 01923 and is currently estimated at $900,856, approximately $289 per square foot. 10 Colby Rd is a home located in Essex County with nearby schools including Danvers High School, St. Mary of the Annunciation School, and St. John's Prep.
Ownership History
Date
Name
Owned For
Owner Type
Purchase Details
Closed on
Jan 10, 2019
Sold by
Cairns Albert H and Chase Tina M
Bought by
Cairns Albert H
Current Estimated Value
Home Financials for this Owner
Home Financials are based on the most recent Mortgage that was taken out on this home.
Original Mortgage
$450,000
Outstanding Balance
$394,058
Interest Rate
4.6%
Mortgage Type
New Conventional
Estimated Equity
$506,798
Purchase Details
Closed on
Aug 17, 2016
Sold by
Cairns Albert H
Bought by
Cairns Albert H and Chase Tina M
Purchase Details
Closed on
Jun 12, 2015
Sold by
Chisholm Ft and Lubas
Bought by
Cairns Albert H
Create a Home Valuation Report for This Property
The Home Valuation Report is an in-depth analysis detailing your home's value as well as a comparison with similar homes in the area
Home Values in the Area
Average Home Value in this Area
Purchase History
| Date | Buyer | Sale Price | Title Company |
|---|---|---|---|
| Cairns Albert H | -- | None Available | |
| Cairns Albert H | -- | -- | |
| Cairns Albert H | -- | -- | |
| Cairns Albert H | $235,000 | -- |
Source: Public Records
Mortgage History
| Date | Status | Borrower | Loan Amount |
|---|---|---|---|
| Open | Cairns Albert H | $450,000 |
Source: Public Records
Tax History
| Year | Tax Paid | Tax Assessment Tax Assessment Total Assessment is a certain percentage of the fair market value that is determined by local assessors to be the total taxable value of land and additions on the property. | Land | Improvement |
|---|---|---|---|---|
| 2025 | $8,318 | $756,900 | $381,300 | $375,600 |
| 2024 | $8,258 | $743,300 | $381,300 | $362,000 |
| 2023 | $8,049 | $685,000 | $346,500 | $338,500 |
| 2022 | $7,882 | $622,600 | $314,400 | $308,200 |
| 2021 | $7,452 | $558,200 | $297,800 | $260,400 |
| 2020 | $7,477 | $572,500 | $294,400 | $278,100 |
| 2019 | $7,247 | $545,700 | $267,600 | $278,100 |
| 2018 | $6,927 | $511,600 | $264,900 | $246,700 |
| 2017 | $6,736 | $474,700 | $231,500 | $243,200 |
| 2016 | $4,419 | $311,200 | $220,800 | $90,400 |
| 2015 | -- | $270,000 | $200,700 | $69,300 |
Source: Public Records
Map
Nearby Homes
- 12 Tulane Rd
- 78 North St
- 26 Ledgewood Dr
- 55 Burley St
- 2 Chapel Rd
- 5 Main Dr
- 16 Burnham Rd
- 3 Conrad Cir
- 207 Topsfield Rd
- 35 Locust St Unit 3
- 7 Paulette Dr
- 20 Central Ave
- 10 Cottage Ave
- 22 Maple Ave
- 14 Chase St
- 19 Bridle Spur Ln
- 43 Hobart St Unit B
- 466 Newbury St Unit 20
- 14 Williams St Unit C17
- 61 High St
Your Personal Tour Guide
Ask me questions while you tour the home.