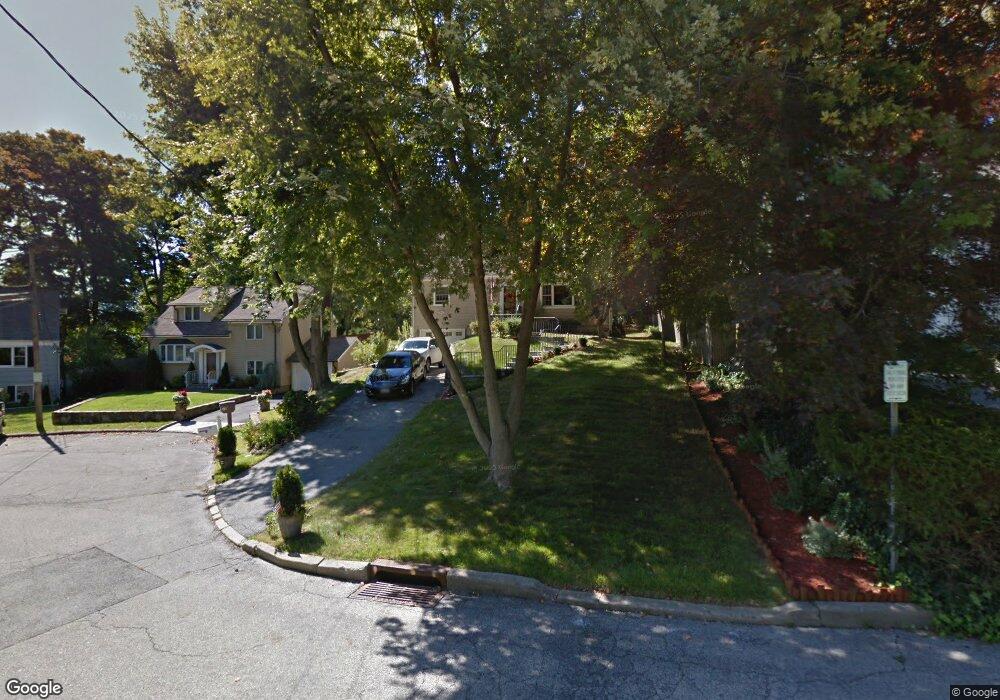
10 Collyer Dr Ossining, NY 10562
Estimated Value: $633,556 - $763,000
4
Beds
2
Baths
1,521
Sq Ft
$456/Sq Ft
Est. Value
About This Home
This home is located at 10 Collyer Dr, Ossining, NY 10562 and is currently estimated at $694,139, approximately $456 per square foot. 10 Collyer Dr is a home located in Westchester County with nearby schools including Park School, Roosevelt Elementary School, and Brookside Elementary School.
Ownership History
Date
Name
Owned For
Owner Type
Purchase Details
Closed on
Jan 18, 2011
Sold by
Adelmann James and Adelmann Jami L
Bought by
Karbon Michael J and Karbon Janine H
Current Estimated Value
Home Financials for this Owner
Home Financials are based on the most recent Mortgage that was taken out on this home.
Original Mortgage
$332,000
Outstanding Balance
$226,239
Interest Rate
4.77%
Mortgage Type
New Conventional
Estimated Equity
$467,900
Purchase Details
Closed on
May 18, 2004
Sold by
Sarubbi Robert J
Bought by
Adelmann James and Adelmann Jami L
Home Financials for this Owner
Home Financials are based on the most recent Mortgage that was taken out on this home.
Original Mortgage
$308,000
Interest Rate
5.94%
Mortgage Type
Purchase Money Mortgage
Create a Home Valuation Report for This Property
The Home Valuation Report is an in-depth analysis detailing your home's value as well as a comparison with similar homes in the area
Home Values in the Area
Average Home Value in this Area
Purchase History
| Date | Buyer | Sale Price | Title Company |
|---|---|---|---|
| Karbon Michael J | $432,000 | Stewart Title Insurance Co | |
| Adelmann James | $385,000 | -- |
Source: Public Records
Mortgage History
| Date | Status | Borrower | Loan Amount |
|---|---|---|---|
| Open | Karbon Michael J | $332,000 | |
| Previous Owner | Adelmann James | $308,000 |
Source: Public Records
Tax History
| Year | Tax Paid | Tax Assessment Tax Assessment Total Assessment is a certain percentage of the fair market value that is determined by local assessors to be the total taxable value of land and additions on the property. | Land | Improvement |
|---|---|---|---|---|
| 2024 | $14,812 | $459,600 | $151,100 | $308,500 |
| 2023 | $14,412 | $433,000 | $151,100 | $281,900 |
| 2022 | $14,285 | $397,500 | $151,100 | $246,400 |
| 2021 | $12,558 | $354,900 | $151,100 | $203,800 |
| 2020 | $14,560 | $354,900 | $151,100 | $203,800 |
| 2019 | $14,632 | $345,900 | $151,100 | $194,800 |
| 2018 | $12,164 | $345,900 | $151,100 | $194,800 |
| 2017 | $1,803 | $339,300 | $151,100 | $188,200 |
| 2016 | $118,798 | $332,600 | $151,100 | $181,500 |
| 2015 | $9,191 | $20,000 | $5,200 | $14,800 |
| 2014 | $9,191 | $20,000 | $5,200 | $14,800 |
| 2013 | $9,191 | $20,000 | $5,200 | $14,800 |
Source: Public Records
Map
Nearby Homes
- 7 Grandview Ave
- 200 Route 9a
- 41 Croton Dam Rd
- 16 Robin St
- 48 Pershing Ave
- 42 Brooke View Dr
- 76 Hawkes Ave
- 40 Minkel Rd
- 7 Bracken Rd
- 33 Ryder Rd
- 113 Antler Ridge Unit 113
- 42 Campwoods Grounds
- 7 Hawkes Ave
- 15 Marshall Place
- 135 - 6 Highland Ave S Unit D1
- 1C Calam Ave
- 47 Stormytown Rd
- 13 Reeback Dr
- 83 Somerstown Rd
- 132 Croton Ave
Your Personal Tour Guide
Ask me questions while you tour the home.