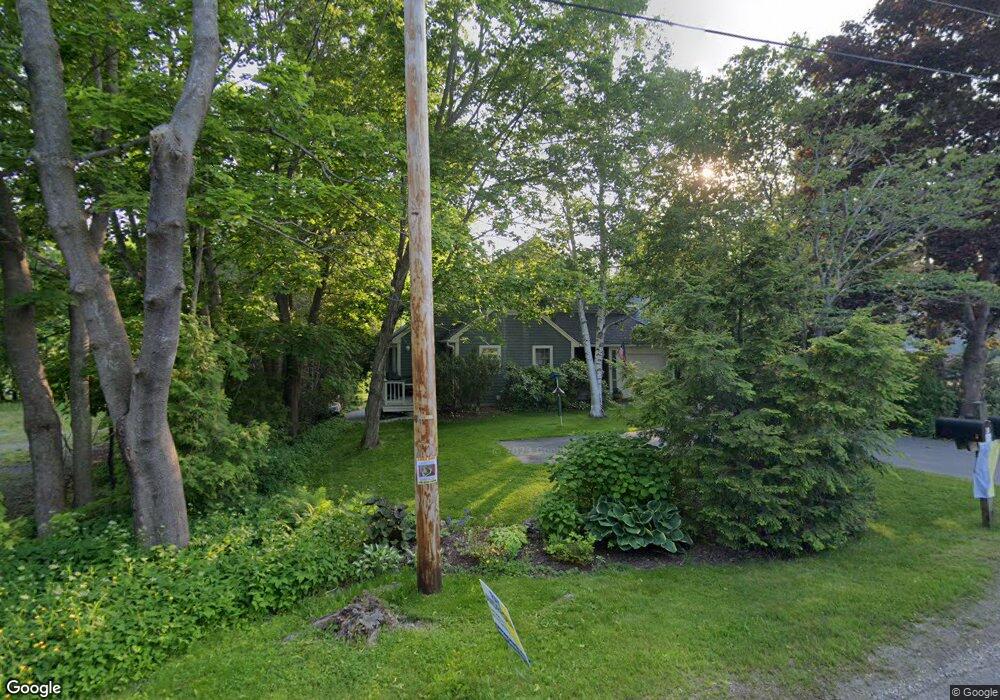
10 Cove Rd Camden, ME 04843
Estimated Value: $592,876 - $886,000
2
Beds
3
Baths
1,485
Sq Ft
$537/Sq Ft
Est. Value
About This Home
This home is located at 10 Cove Rd, Camden, ME 04843 and is currently estimated at $796,969, approximately $536 per square foot. 10 Cove Rd is a home located in Knox County with nearby schools including Camden-Rockport Elementary School, Camden-Rockport Middle School, and Camden Hills Regional High School.
Ownership History
Date
Name
Owned For
Owner Type
Purchase Details
Closed on
Apr 12, 2021
Sold by
Babbitt Jane G
Bought by
Babbitt Thomas J and Babbitt Jane G
Current Estimated Value
Home Financials for this Owner
Home Financials are based on the most recent Mortgage that was taken out on this home.
Original Mortgage
$190,000
Outstanding Balance
$171,547
Interest Rate
3%
Mortgage Type
Purchase Money Mortgage
Estimated Equity
$625,422
Create a Home Valuation Report for This Property
The Home Valuation Report is an in-depth analysis detailing your home's value as well as a comparison with similar homes in the area
Home Values in the Area
Average Home Value in this Area
Purchase History
| Date | Buyer | Sale Price | Title Company |
|---|---|---|---|
| Babbitt Thomas J | -- | None Available |
Source: Public Records
Mortgage History
| Date | Status | Borrower | Loan Amount |
|---|---|---|---|
| Open | Babbitt Thomas J | $190,000 |
Source: Public Records
Tax History Compared to Growth
Tax History
| Year | Tax Paid | Tax Assessment Tax Assessment Total Assessment is a certain percentage of the fair market value that is determined by local assessors to be the total taxable value of land and additions on the property. | Land | Improvement |
|---|---|---|---|---|
| 2024 | $5,390 | $513,300 | $150,000 | $363,300 |
| 2023 | $4,263 | $308,900 | $100,000 | $208,900 |
| 2022 | $4,077 | $308,900 | $100,000 | $208,900 |
| 2021 | $4,054 | $264,100 | $75,000 | $189,100 |
| 2020 | $3,969 | $264,100 | $75,000 | $189,100 |
| 2019 | $3,938 | $264,100 | $75,000 | $189,100 |
| 2018 | $3,500 | $235,200 | $75,000 | $160,200 |
| 2017 | $3,382 | $235,200 | $75,000 | $160,200 |
| 2016 | $3,851 | $247,000 | $69,400 | $177,600 |
| 2015 | $3,737 | $247,000 | $69,400 | $177,600 |
| 2014 | $3,564 | $247,000 | $69,400 | $177,600 |
| 2013 | $3,468 | $247,000 | $69,400 | $177,600 |
Source: Public Records
Map
Nearby Homes